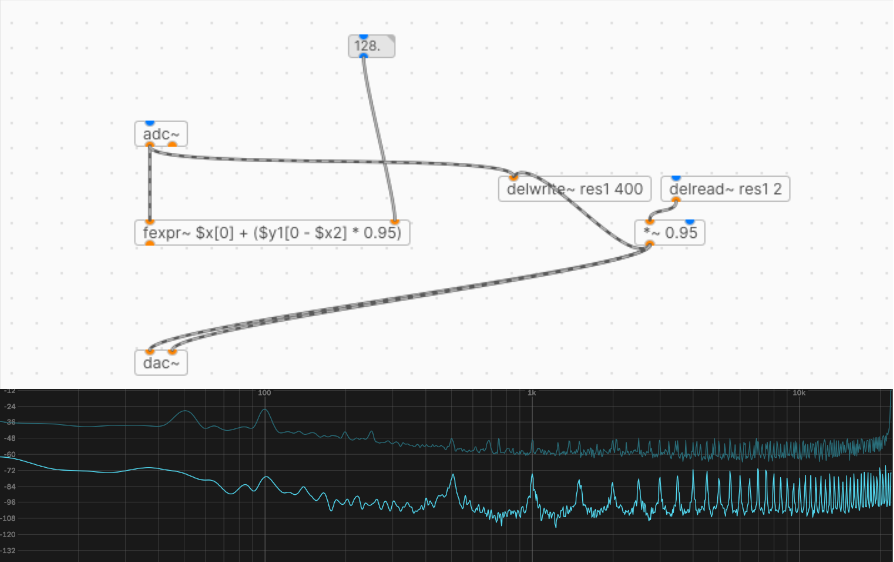
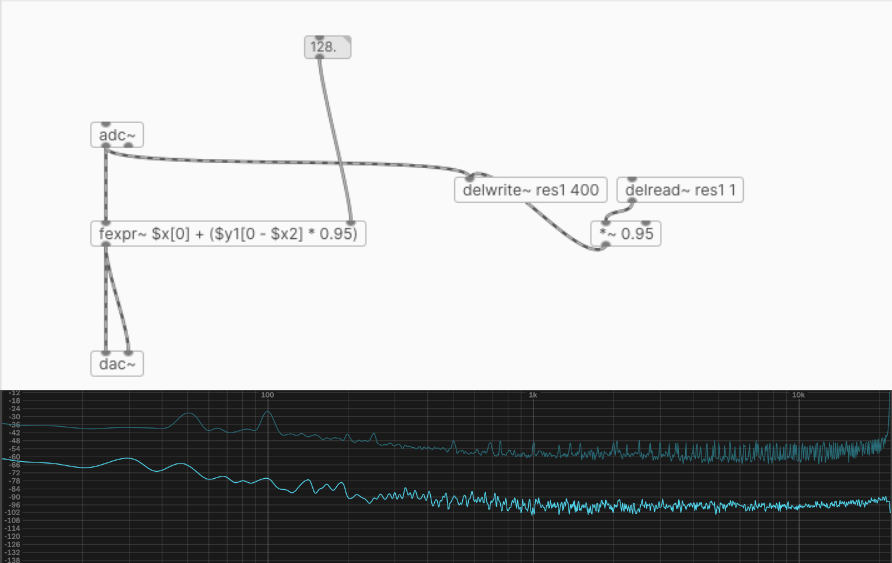
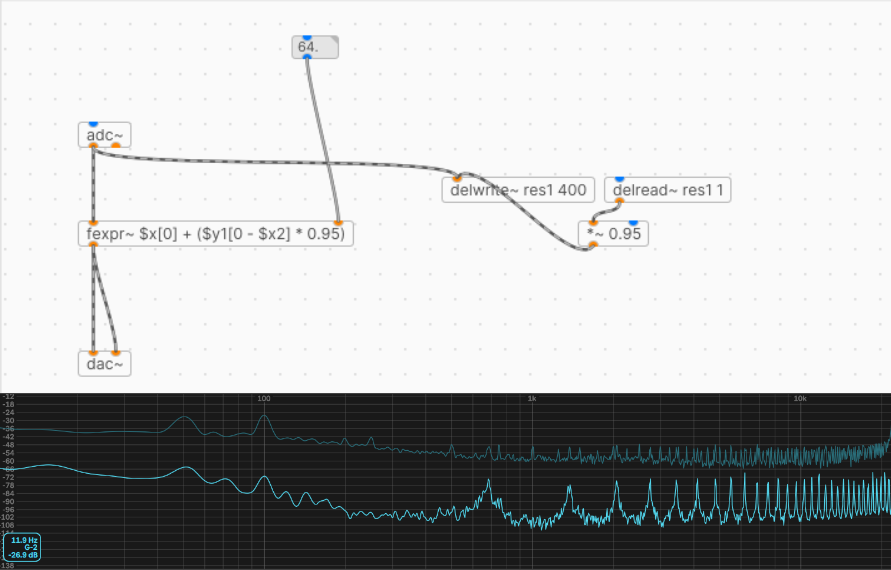
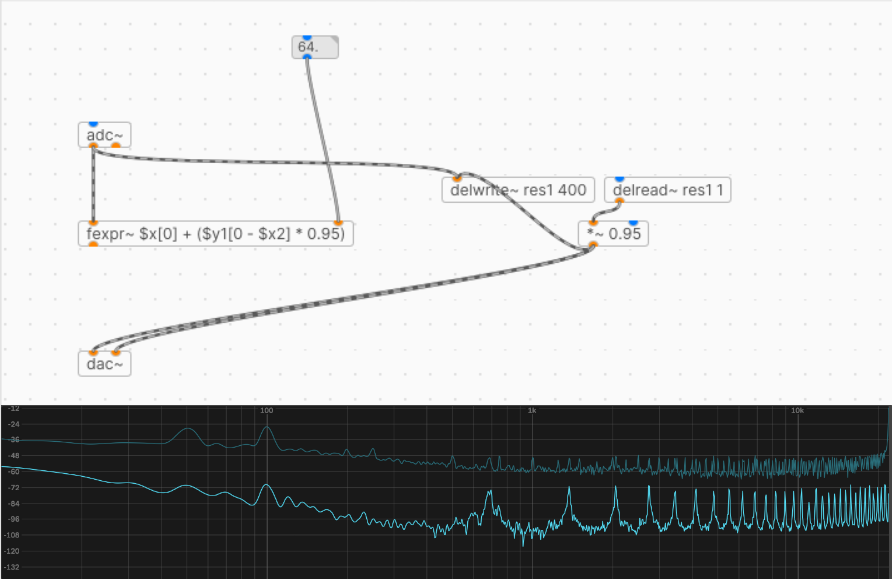
Karplus strong and strange issues with fexpr~
these are some pictures with the pd patch and below a spectrogram so you can see what I mean
 posted in technical issues
Aliasing line ~ ?
imo this is a weird usage of [cos~]. why not just feed a single frequency into [osc~]? anywaways if you are set on doing it this way you could try using [vline~] and see if it's any better because [vline~] uses doubles. you could also try using [wrap~] before [cos~].
but you might also be getting artifacts in the spectrogram from a sudden change in frequency (to 0)...
edit: basically it's not recommended to use large numbers to drive [cos~] but I forget if [wrap~] helps or not. the error might be present at that point already..
edit2: personally I use my own sine tables if I want really clean sine waves because the ones pd uses internally still sound a bit gritty to me sometimes, I think they use 512 points and I usually end up using tables that use 2048 or 4096 points
 posted in technical issues
x/y data from excel into PD and then transform into sound
Hello PD community!
As part of a personal project, I need to transform columns of data (two variables) to sound. My variables are "x": distance and "y": height, so I would like the transformation to be to "x": time and "y" :frequency (hz). I tried several methods like first plotting the data and then entering it into software like AudioPaint or Coagula, but the result when looking at the spectrogram in software like Audacity leaves a lot to be desired, it's very messy. I tried a software called SIGVIEW and it's not neat enough either.
Three days ago I started with Pure Data, and this is what I have learned playing with the software:
First I need to create a frequency modulated synthesis, where the carrier would be my "x" values, and the modulator would be my "y" values. This I was able to do already.
I have to export my data from excel in .csv or .txt format.
What I know and I don't know how to do it:
input the .csv or .txt data to Pd (I have read and seen several patch models, but I am far from understanding how they work). For example when I look at the Pd browser and the instructions tell me to create a message object that says |open .txt|, I understand the logic. But I also understand that I can't open any .txt as I haven't created any. Sorry for being a newbie
Assign my "x" data to the carrier and assign my "y" data to the modulator.
I know this isn't the first time someone has asked this question, but the answers I've found have given me little clarification and even left me more confused.
I would really appreciate any tips you can give me!
Regards!
 posted in tutorials
Passing ftt values to Android app
Thanks for your reply, bocanegra. Eventually, I found out Android allowed me to use a samplerate of 8000Hz and that was low enough to allow me to create a wideband spectrogram (125Hz per band). Thanks to everyone for your replies.
 posted in libpd / webpd
Passing ftt values to Android app
@MDobleZ said:
I'm trying to create a wide-band spectrogram app for Android.
@MDobleZ said:
Apparently, it cannot be done, since you can neither force the sampling frequency to be low enough nor the blocksize to be high enough to get a narrow-band spectrogram.
Wide? Narrow?
There are numerous ways of representing a spectrum graphically with or without [rfft] . Most have been covered within PD vanilla (libpd compatible) over the years.
If [rfft] doesnt cut it because you want detailed info on formants between 300 to 1500 Hz, you can use [sigmund~] to single out frequencies/peaks on a bandlimited signal
 posted in libpd / webpd
Passing ftt values to Android app
Apparently, it cannot be done, since you can neither force the sampling frequency to be low enough nor the blocksize to be high enough to get a narrow-band spectrogram.
posted in libpd / webpd
Passing ftt values to Android app
Sorry, yes, I'm using libpd. I'm trying to create a wide-band spectrogram app for Android.
posted in libpd / webpd
Best way to avoid clicks (tabread4~)
Amplitude modulation of any sort, including envelopes, always distorts the spectrum to some extent.
Normally we don't notice because typical sounds have a complex spectrum, which masks the distortion.
But here, you are applying it to an artificially simple spectrum, containing only DC offset. DC offset is silent, and the spectral distortion is not, so there is nothing to cover it.
I generated an audio file with a 30 ms ramp up and 50 ms ramp down. For comparison, I applied this envelope to a sine wave in the right channel. Then I opened this file in Audacity and looked at the spectrogram.
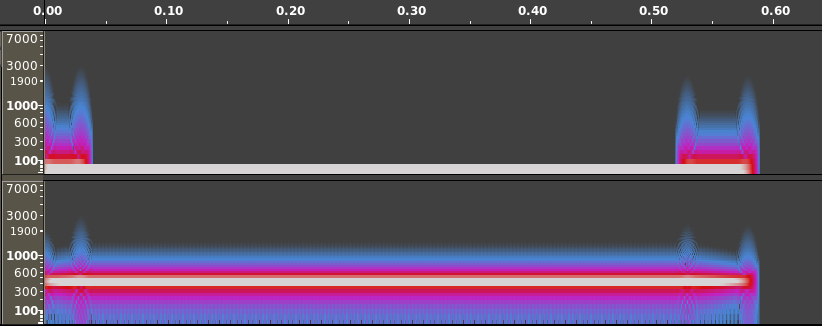
I think it's pretty easy to see here why the envelope might be audible in the case of DC * envelope, but not perceptible in the case of the audible signal * envelope.
Bottom line is, just because you hear spectral distortion in an artificial scenario which you would never encounter with audible signals, doesn't mean that it will be noticeable in real world scenarios.
(Carrying it further: If there is no envelope, there's a risk of an instantaneous transition from non-zero to zero or vice versa. Instantaneous transitions require a lot of high-frequency content, which we hear as a click. A linear transition effectively lowpass-filters the instantaneous transition -- there are still artifacts, but they are relatively low amplitude, and in a frequency range normally occupied by musical tones at a much higher amplitude. A ramp-enveloped sound will never be perfect, but it's better than a rectangular envelope.)
"replaced by something better" -- A sinusoidal envelope shows a smoother spectrogram. You might try that: cos * 0.5 + 0.5 -- from pi to 2pi is your ramp up, 0 to pi is the ramp down.
Edit: You can eliminate the +0.5 by squaring the cos and halving theta, because cos^2 x = cos(2x) * 0.5 + 0.5. Actually cos~, IIRC, scales radians down to 0 .. 1, so you could do line~ --> cos~ --> [*~] (cos~ to both inlets) and drive it by "0.25, 0.5 30" for the ramp up, and "0, 0.25 50" for the ramp down. Haven't verified this at the computer but I think it's right.
hjh
 posted in technical issues
Easy resonant lp filter?
@ddw_music here https://github.com/pure-data/pure-data/tree/master/extra/bob~ miller refers to the "cutoff frequency" which would be an odd term to use for a bandpass filter.. if you look at bob~ without any resonance it definitely behaves like a a lowpass.. I think that as the resonance goes up the pass-band might get attenuated? most discussions of the moog ladder filter refer to the lowpass filter (rather than the High-pass one) and since this certainly is not a high-pass filter I would say that in all likelihood it's an emulation of the lowpass species.
If you want to go for instructional clarity I agree that maybe other filters look more like "lowpass" filters in spectrograms tho (but bob~ still sounds like a lowpass to me imho)
posted in technical issues
Easy resonant lp filter?
This screenshot of a spectrogram recorded by alternating bob~ with a biquad low pass filter shows:
- bob~ attenuates both low and high frequencies somewhat.
- The biquad attenuates high frequencies significantly, but not low (the stronger band in the middle is resonance from Q).
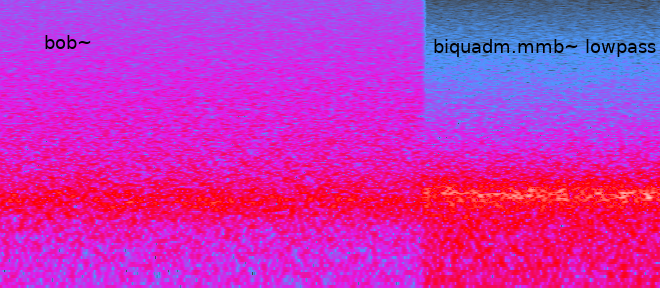
bob~ doesn't sound to me like low pass, nor does its observed frequency response look like low pass.
hjh
posted in technical issues