Ofelia rendered Spectrogram?
Hi @Kitty Dyson. I tried to port a spectrogram shader to ofelia. Just updated it for Ofelia v3. You need to change it a bit for your desired result.
You can download it here (it is the sonogram patch): https://forum.pdpatchrepo.info/topic/12168/3-shader-adaptions-sonogram-vectorscope-and-conway
But I am sure you can implement a spectrogram without shaders too.
 posted in pixel#
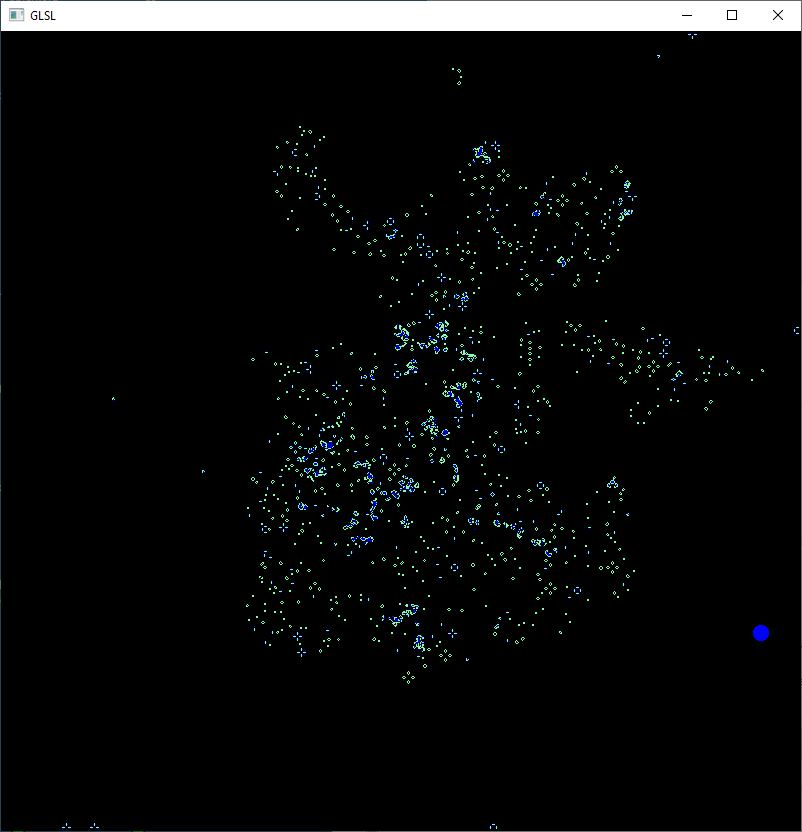
3 shader adaptions: sonogram / vectorscope and conway
in tried to implement three shaders that could be useful with pure data.
the shaders are not my work, but i had to adapt and to learn a lot to make them work with pure data.
would be nice to improve them further.
i put the links from the shaders as comments into the frag. files.
ofelia_conway_sonogram_vectorscope.zip
the spectrogram works quite well, but i do not know if i implemented the best fft algorithm for that case / and in the right way...).
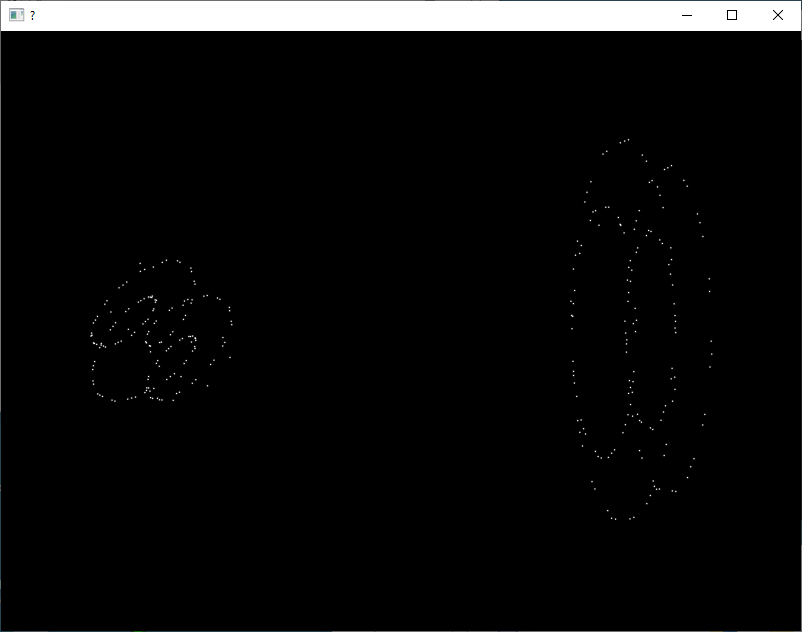
the vectorscope is quite gpu expensive. from the comment:
"GLSL is the absolutely worst medium for rendering this,
but Shadertoy seemed like a good place to find people who
might have ideas about this.
On the left is a return diagram. It is an X-Y plot of a
function against itself at a constant offset. The offset is
a tunable parameter. If it is set to one fourth of the
period of a certain frequency, then waves at that frequency
will cause the diagram to draw circles. Other frequencies
will cause some kind of ellipses.
On the right is a phase space diagram of the signal. It is
an X-Y plot of the signal against its differential. The
scaling factor applied to the differential is a sort of
tunable paramater too, which again allows you to choose one
frequency to form perfect circles.
These both draw kind of neat patterns, but not really neat
enough to work as visualization. How could this be improved?
(You'd probably have to do it in something other than a single
shader, though, to be able to draw more points, or lines.
Having access to more of the signal might also be a good thing.)"
The conway shader works good, but i do not understand it enough to change the rules or even the size of the cells...
posted in patch~
unexpected spectrogram?
@leech If you reduce the dynamic range of the spectrogram, or increase the resolution, or both, you can get it to show a line at 80Hz.
40dB and about 16384 bins should give you a red line with standard colours.
Although a sine wave has a constant frequency the rate of change of amplitude varies over the cycle.
Windowing functions are used with FFTs. These transform the signal block-by-block into a spectral representation whose resolution (accuracy) in both the frequency and time domains are proportional to their size.
Unless the window "width" ...... time....... matches the width of a cycle or cycles of the sine wave you will get spectral leakage.
http://download.ni.com/evaluation/pxi/Understanding FFTs and Windowing.pdf
David.
 posted in technical issues
unexpected spectrogram?
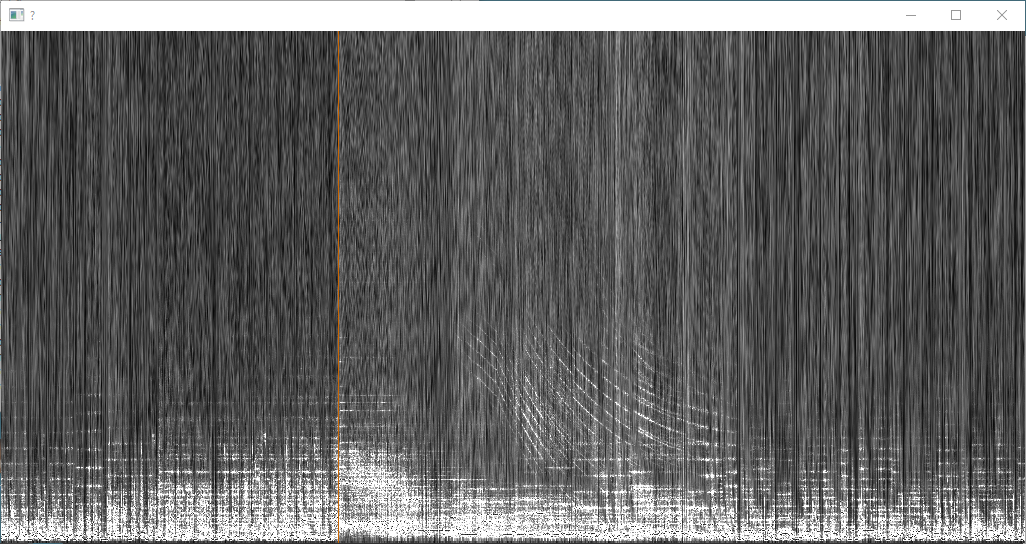
Hey guys, I just tried to record a simple osc~ 80 Hz in a wav file.
When I open the file in sonic visualiser to get the spectrogram I wasn't expecting it to be like this but to clearly show a red line at 80Hz and nothing else..? What am I missing? Spectrogram attached.
Thanks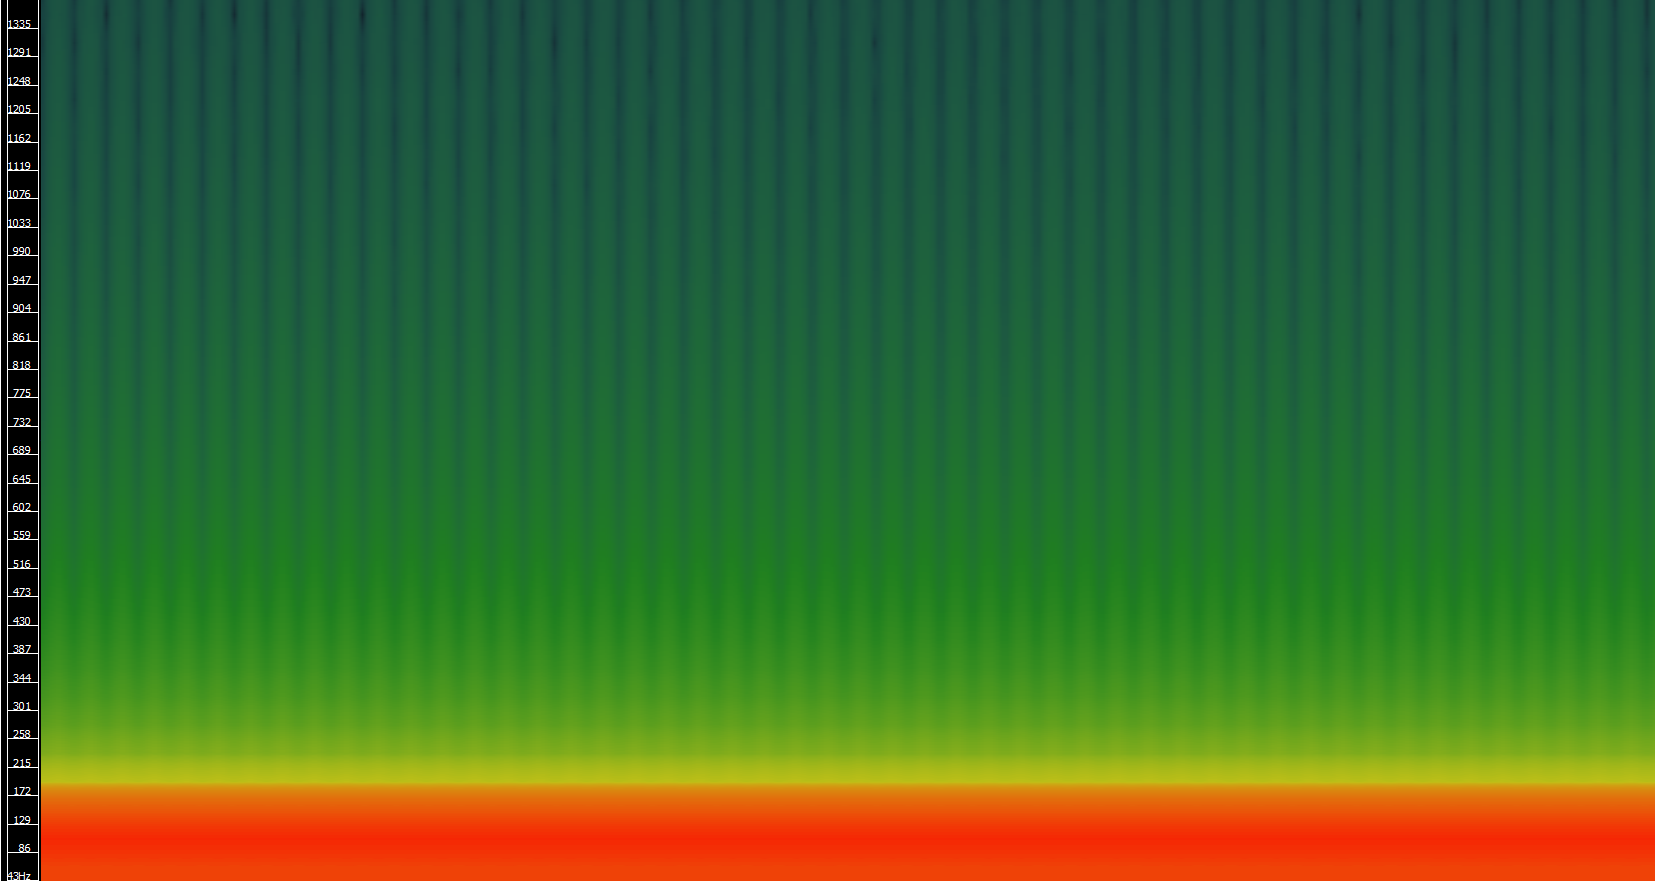
 posted in technical issues
Analyzing & Synthesizing a Cowbell
In Sonic Visualizer, there's a spectrogram option called 'Bins' that, when I set it to 'Frequencies', seems to show precise frequencies like SPEAR, but with a higher resolution/more info. I'll try using that for a new analysis and see if it helps...
I guess I should read through the SV documentation at some point.
 posted in technical issues
Hearing Loss Simulation
@Azoso Hello and welcome to the forum.
It can all be done of course.
I would recommend starting with an installation of Pd extended if possible, rather than Vanilla, as at least one of the tools that you need (spectrum analyser) is then immediately available in the download.
If you are using a recent 64-bit mac os then that will not be possible, and things get more complicated.
You will then need to use "help" "find externals" from the Menu of Pd and download all the externals.
You can always switch to Vanilla later when you know more about the workings of Pd "under the hood".
The spectrum analyser (probably the most difficult part of your project) can then be created instantly by placing an object [spectrogram~-help] in your patch. Then right-click it to open it.
You can see it working by connecting an [adc~] to the [spectrogram~] object instead of the [noise~] object...... and you will be inspired to continue.
Then change [spectrogram~-help] to [spectrogram~] so as to use it in your patch.
Come back when you get stuck!
David.
posted in technical issues
generate audio from image as spectogram
I misread the question. Forget the part about the histogram and just fit the spectrogram in a [rifft~] window.
 posted in pixel#
Phaser / Chorus / Flanger
@Pierre-Guillot super thanks ")
btw is the spectrogram object available in pd, or is it pd-extended stuff or a plugin... ?
 posted in patch~
Phaser / Chorus / Flanger
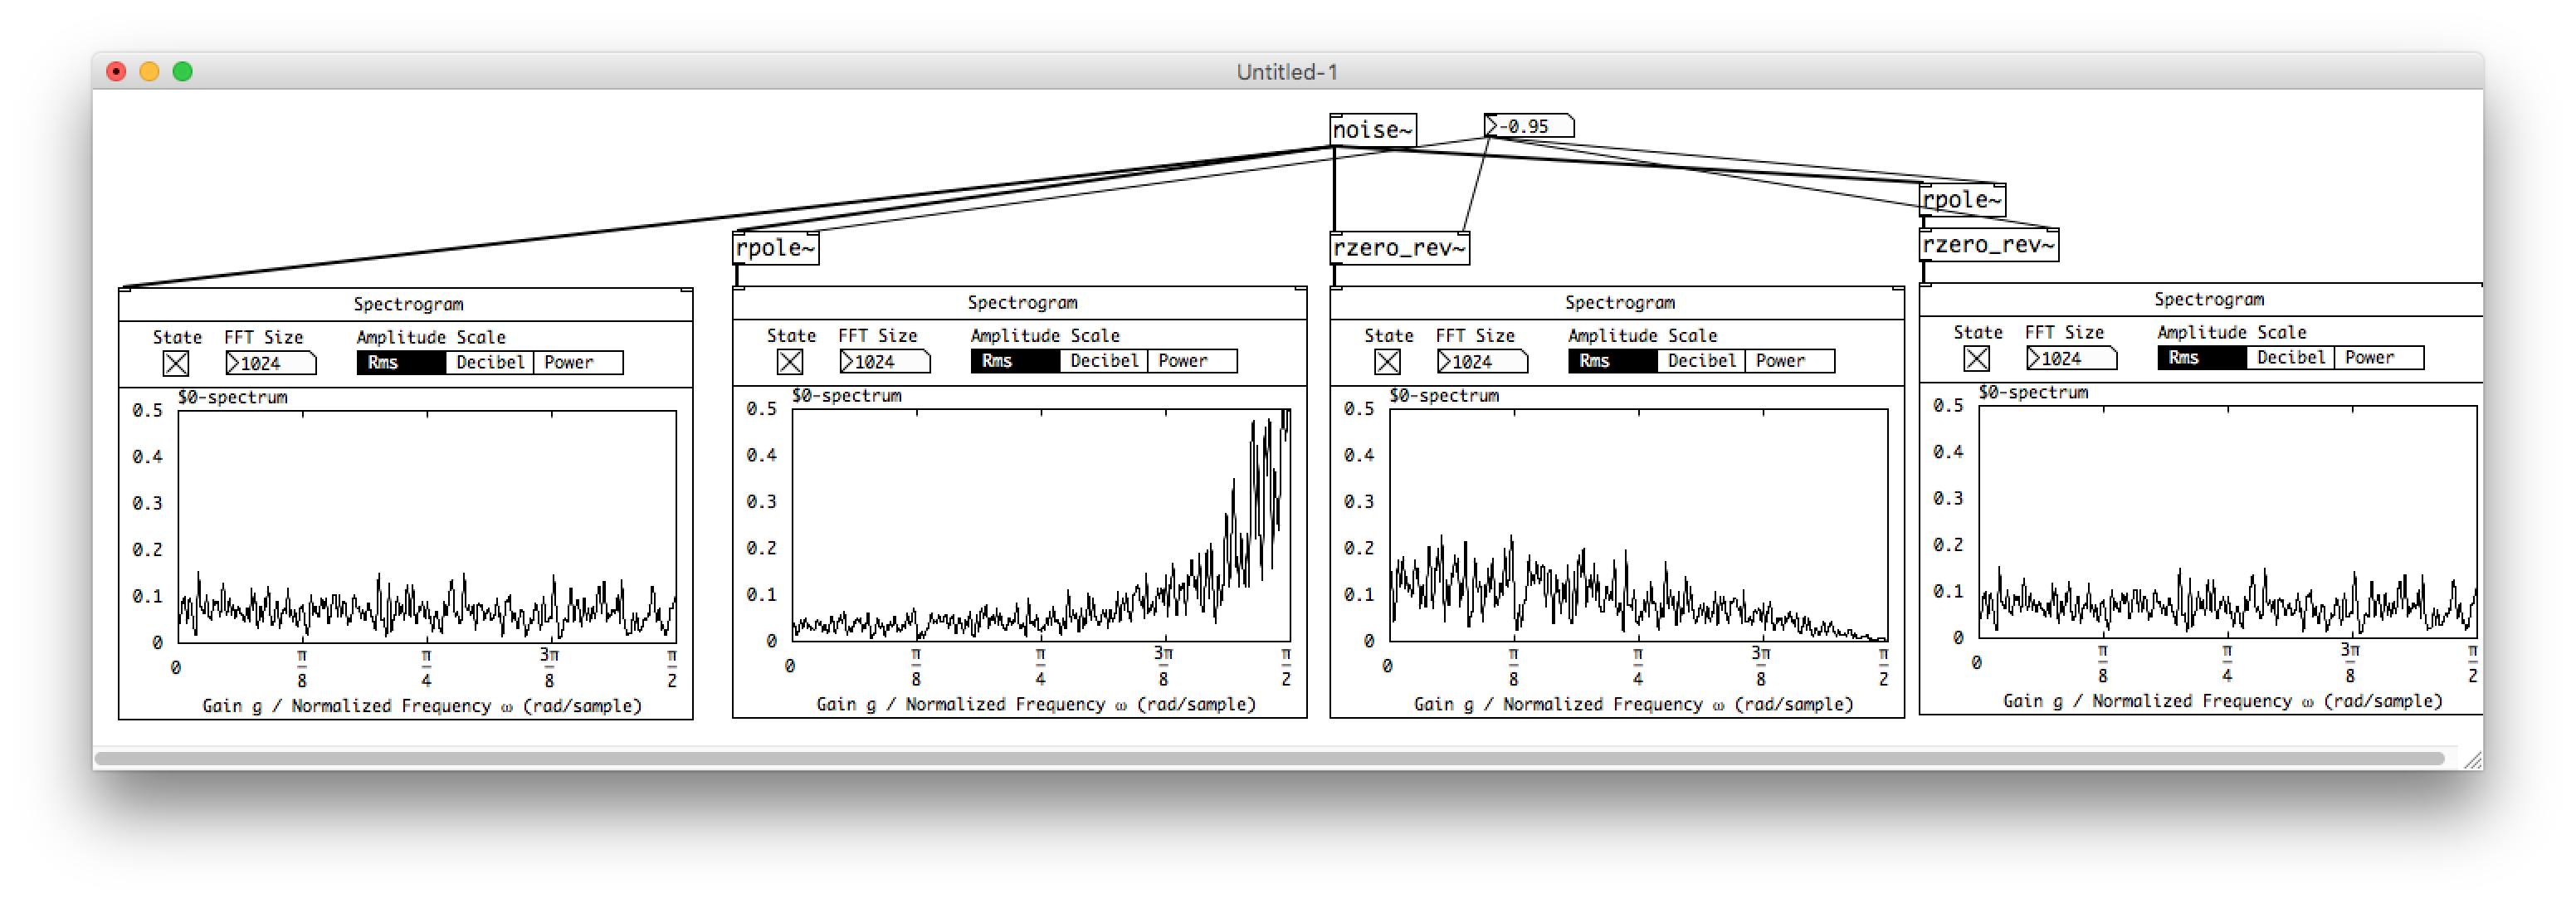
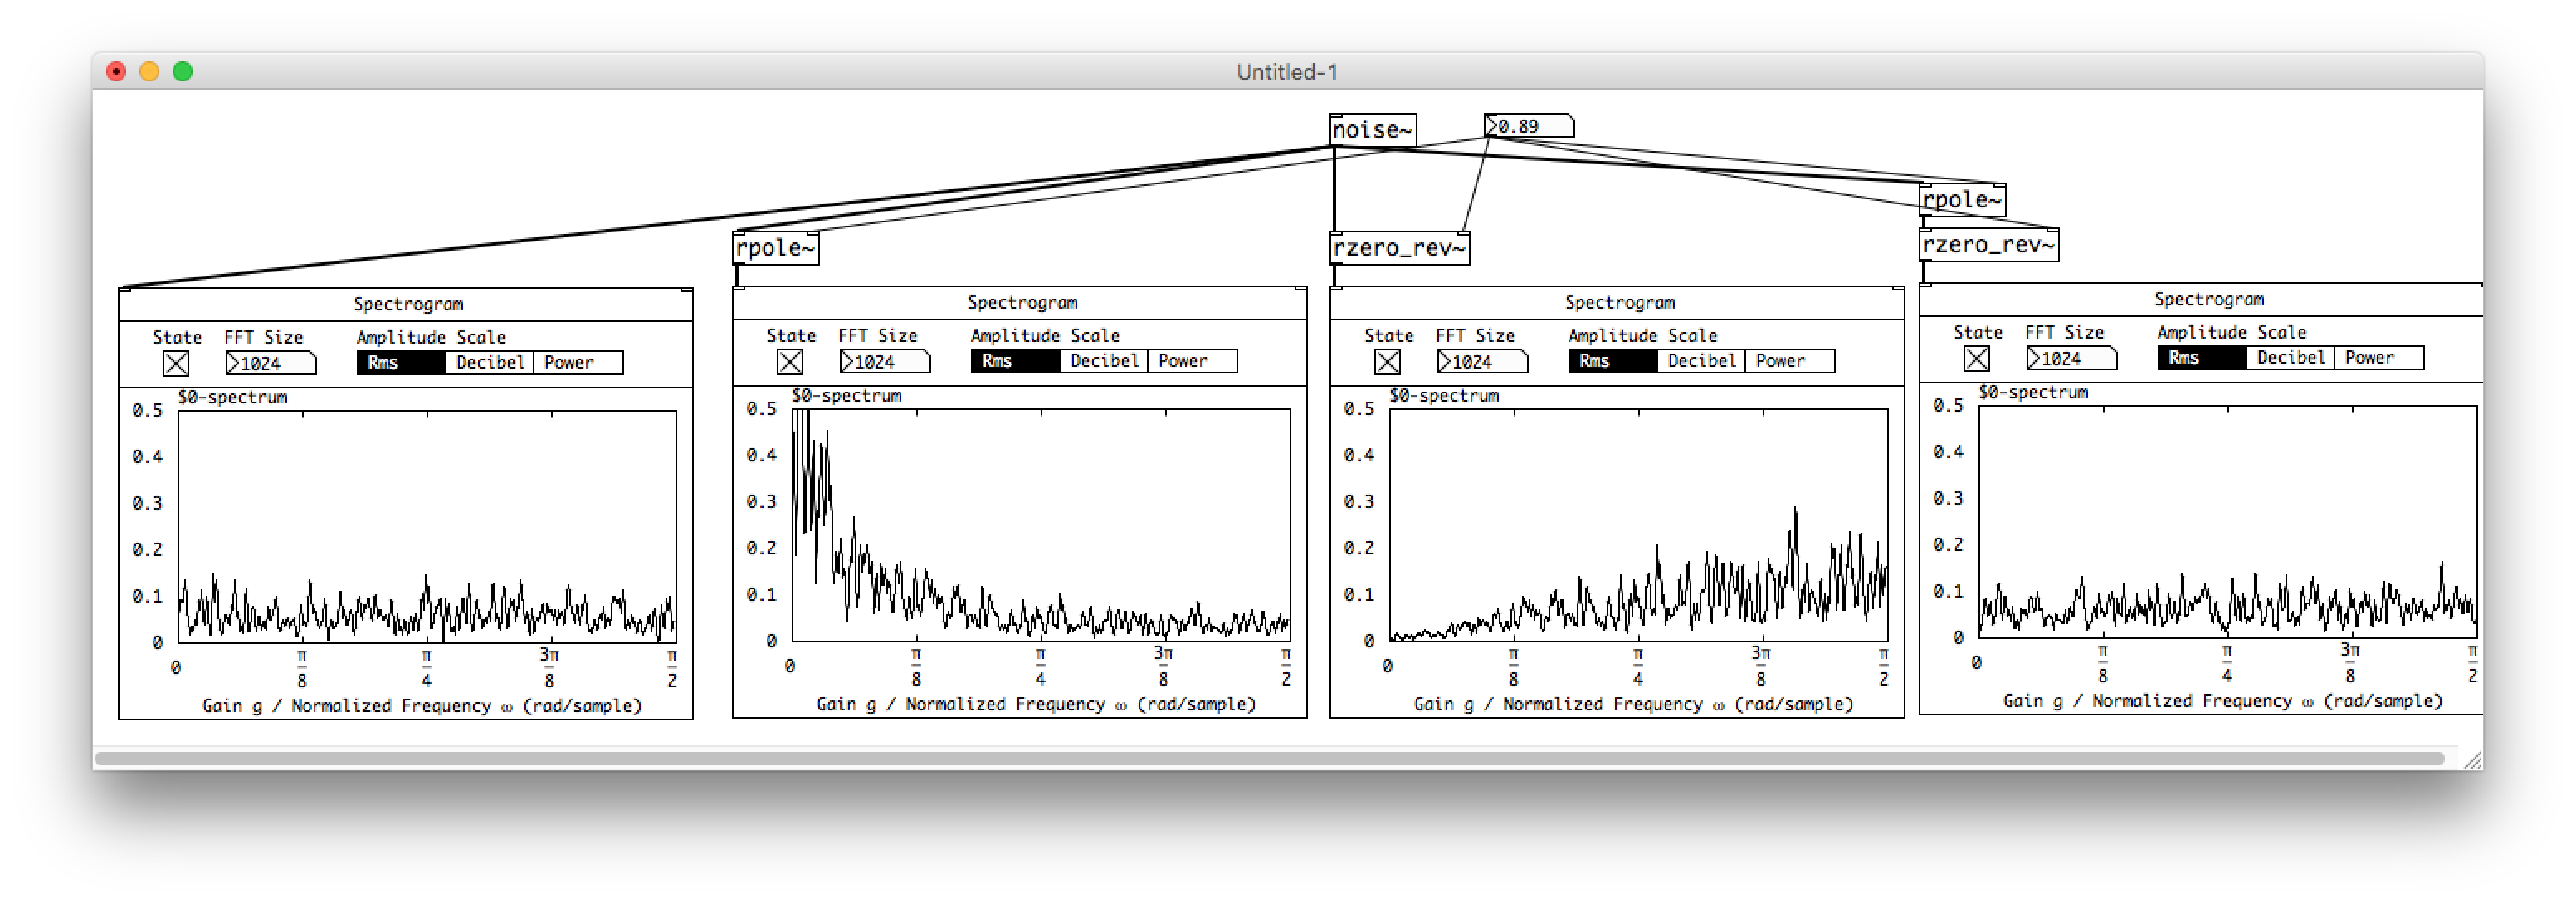
The pictures represent the spectrograms (sometime called sonograms). frequency X time and amplitude is represented by color.
rzero_rev and role are two lowpass/high pass filters (depending on the coefficients). Used together with the same coefficient, they become an allpass filter. The amplitude response is linear but the phase response varies depending on the coefficient; the phase of frequencies is more or less inverted depending on the coefficient. If you use several allpass filters in serie, more band of frequencies are dephased. If the filtered signal is fed back into the original signal, it generates at set of notch filters and peak filters due to the phase oppositions. The main difference with the flanger is the repartition of the filters (harmonic or not).
 posted in patch~
3d Spectrogram
Hi,
This patch just graphs amplitudes of your sample at frequencies in time.
It works best if you open the soundfile subpatch and load your own .wav file (otherwise just use the default sample).Then click the start render toggle, use the 'scrub' slider to move through the sample, and click and drag to move around in the gem window.
The other options include the number of FFTs to display, rotation of the spectrogram on the z axis, the zooming factor, or graph input from the microphone.
I think I fixed the error messages, and I added some more comments to the patch. The patch is probably more complicated than it needs to be, but it should work more clearly now.
Let me know if there are any more problems or anything.
 posted in pixel#