Objects for formant synthesis?
@porres The cosine version looks the same as before with fundamental=264, formant=650, bandwidth=10. The top spectrogram is Miller Puckette's paf~, bottom is else/paf~
I just noticed one small difference; the cosine version has a small peak below 40hz that the previous version didn't have.
 posted in technical issues
Objects for formant synthesis?
@porres I copied everything and I'm not getting that message anymore, but else/paf~ does not give the same results as Miller Puckette's paf~. The first image shows spectrograms from both versions of paf~ with the first six harmonics of the fundamental frequency=264, the formant center frequency=650, and the bandwidth=80. Miller Puckette's paf~ is at the top, and else/paf~ is at the bottom. The second and third harmonics are about the same in both, but the other harmonics are significantly higher in else/paf~.

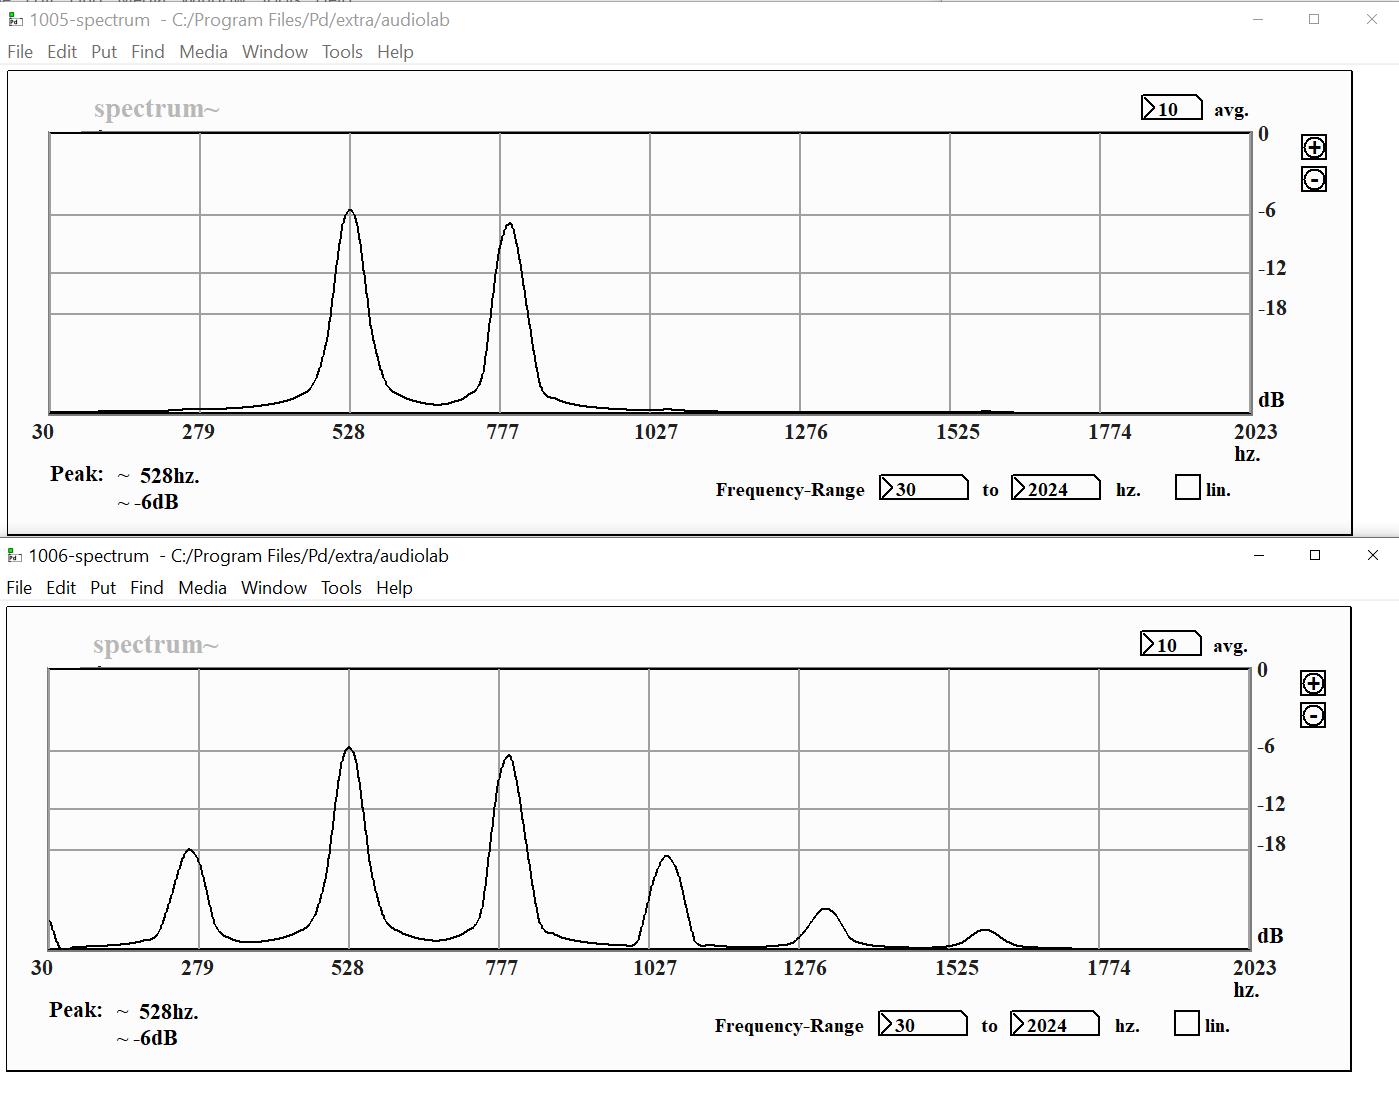
The second image is the same except with bandwidth=10 in both versions of paf~. Changing the bandwidth to 10 made a big difference in Miller Puckette's paf~. All but the second and third harmonics were eliminated. Changing bandwidth to 10 in else/paf~ made almost no difference in the spectrogram or in the sound.

The third image shows both version of paf~ with bandwidth=500. The results were much closer, but not identical. The highest peak in Miller Puckette's paf~ was at 528 hz, while the highest peak in else/paf~ was at 793 hz.

posted in technical issues
Objects for formant synthesis?
@porres I tried both of the example patches you posted. The first one produces significant levels of harmonics well past the Nyquist frequency which gives it a harsh sound. I think it needs a low pass filter. Also, the bandwidth parameter seems to act more like a volume control than what I expect bandwidth to do. It doesn't seem to alter the shape of the formant. It just raises and lowers the volume of all of the harmonics.
The second one produces the spectrogram I expect from FOF. The high harmonics die out to zero after the formant peak. Also, the bandwidth parameter actually alters the shape of the formant, which is what it should do.
I can't see myself using the first one, but I'll do some comparisons between the second one and paf~. I like paf~ so far. Since the patent on paf has expired, there's no reason not to use it.
posted in technical issues
Objects for formant synthesis?
@porres said:
cyclone does not have a [spectrogram~] object
ELSE has [spectrograpg~] though.
Thanks -- I didn't look closely enough at the help patch.
About formant synthesis with FM, I know Miller includes something like that in the audio examples (see F10). Is it related maybe?
It probably is, and his implementation is probably more elegant than mine (though it's jammed into a small space on the screen so it's a bit tough for me to read quickly).
It takes some tuning -- the FM index isn't a simple analog to formant bandwidth (it seems to need to be scaled down at higher pitches). But it's computationally cheap and gets a useful result, and it seemed to fit "approaches to formants other than bandpass filtering."
hjh
 posted in technical issues
Objects for formant synthesis?
@ddw_music said:
spectrogram~ is from cyclone
cyclone does not have a [spectrogram~] object
ELSE has [spectrograpg~] though.
About formant synthesis with FM, I know Miller includes something like that in the audio examples (see F10). Is it related maybe?
 posted in technical issues
Objects for formant synthesis?
There's also the John Chowning "Phoné" FM formant approach, where the carrier is at the formant center frequency and the modulator is at the fundamental. It's "formant-ish" I suppose, but sweeping the fundamental while holding the formant frequency steady does produce a vocal-ish sound.
Here I'm crossfading between two formants, to make smooth transitions between integer carrier-mod frequency ratios.

Oops, no: (~[spectrogram~] is from cyclone -- not essential to the patch's operation.)
(~[spectrograph~] is from ELSE -- not essential to the patch's operation.)
hjh
posted in technical issues
Formant synthesizer possible in PD?
Hello to who might ever read this post!
We are a group of linguistics students with no prior knowledge in PD.
Our goal for the project is to achieve a sort of game that the participants can try out: They listen to a prerecorded audio sample of a vowel (from any language, doesn´t have to be English or German), and their job is to match what they are hearing on the synthesizer. Ideally, they get some sort of visual interface where they can manipulate three parameters, which correspond to F1, F2 and F3 respectively (basically a simulation of the vowel map). As part of the game they get a set number of tries to "find" a spot on the simulated vowel map that matches what they heard from the recording. After their tries are up we can compare their result to what the ideal result would have been, possibly showing spectrograms and explaining the parameters / formants. So our idea is a game for the participants which results in a small educational part on our topic.
Has anyone ever done this or something similar in PD? Is what we are planning to do even possible?
 posted in technical issues
RMS slow human
this is not a precise imitation and i'm not sure if it can be done more efficiently - but it works quite well by smoothing the graph value updates, effectively low-passing them by only adding a fraction of the difference (i'm also differentiating between rising and falling values - the rising ones are less filtered):
this could be done in vanilla - but the tab_* objects of the iem_tab library are certainly a lot faster.
for smoothing the graph itself, i use convolution (tab_conv) with a small smoothing kernel. another option there is tabreceive~ -> lop~ -> tabsend~. the result looks ok as well, but it's obviously not symmetrically smoothed then.
not sure if these explanations make sense. but since i was working on some spectrogram stuff today, this question resonated and made me try to respond. ")
EDIT: btw., the signal in the video is just pink noise on/off.
 posted in technical issues
Audio visualizer patches?
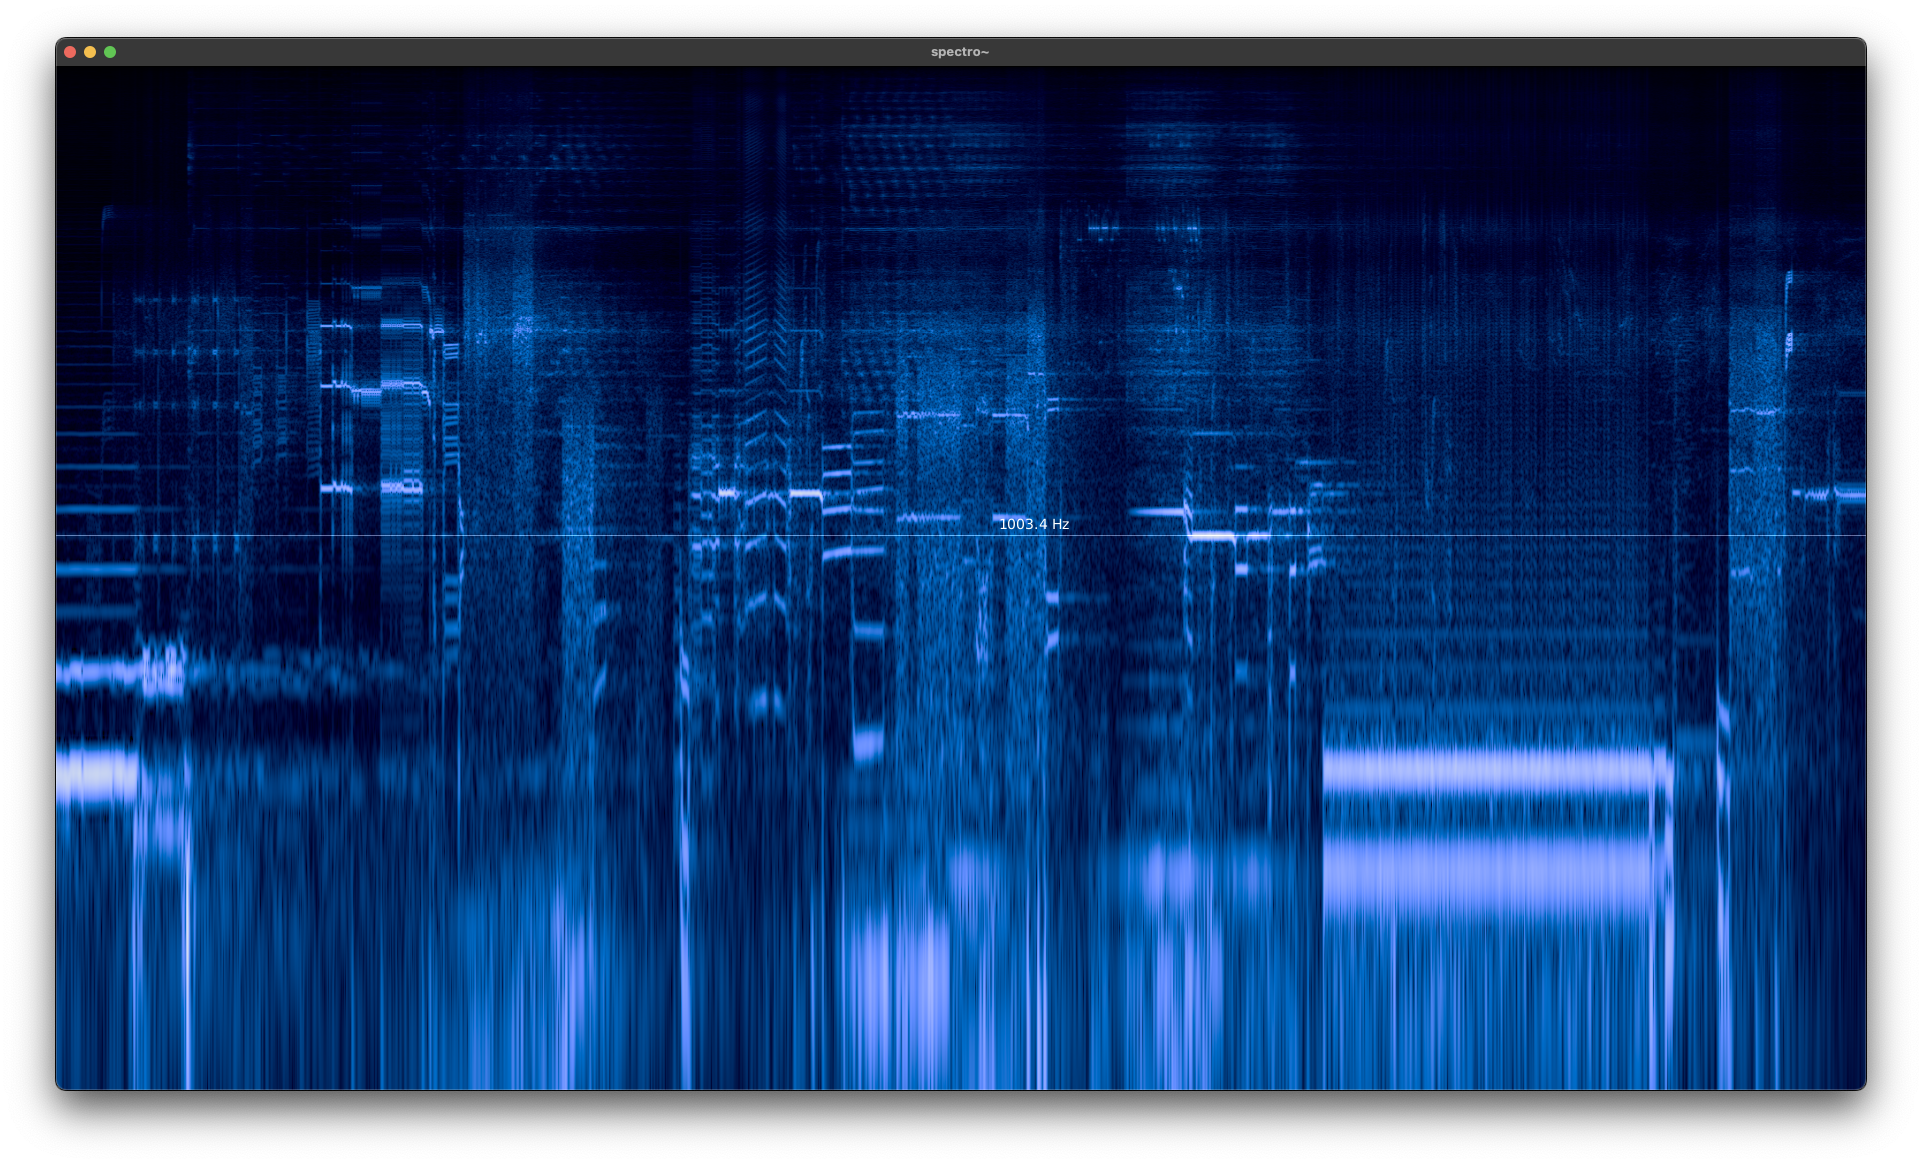
i just uploaded a spectrogram built with Gem. It's not very efficient and i might give it another try with shaders doing the drawing and logarithmic mapping. but anyway - seemed like an appropriate contribution to this thread:
https://github.com/ben-wes/pd-spectro_tilde
posted in patch~
Audio visualizer patches?
Hi,
what are the best patches for pd (on linux) regarding audio visualization (from spectrogram to any other diagram) or audio reaction (of any type, even fantasy)?
Thank you,
a.
 posted in patch~