ADSR from scratch
@JuanMadrid Hello. You can use the [curve~] external, or if natural curves are sufficient then square the output of [vline~]......
See this thread....... https://forum.pdpatchrepo.info/topic/9819/curved-adsr-envelope/3
And yes... you cannot open that adsr object because it is not a patch. It is a compiled object like [vline~].
David.
 posted in patch~
bezier curve system and pixel pen
bezier curve system and pixel pen

https://patchstorage.com/bezier-curve-and-pixel-pen-pd-vanilla-gem/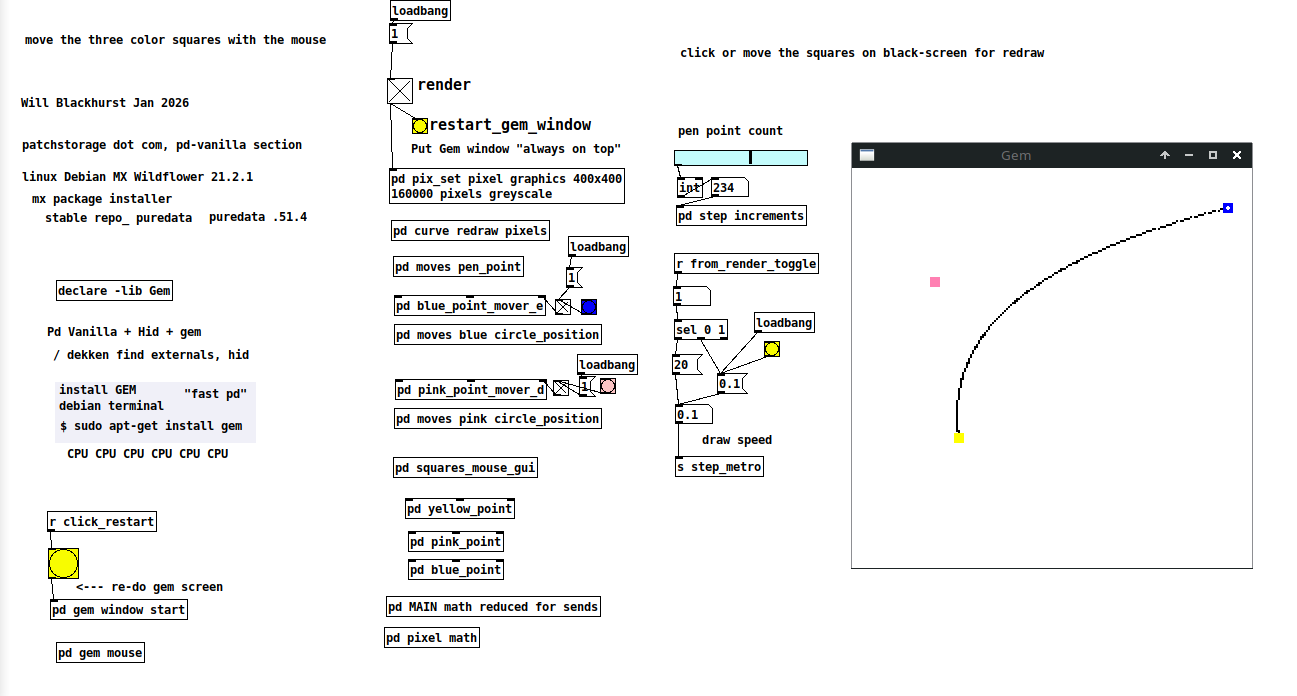
 posted in patch~
Read data from txt and plot overlay graphs
Hi all,
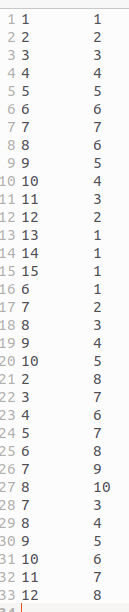
I have a txt file containing x,y values from multiple overlaid graphs.
For example, this txt file contains (x,y) coordinates for 4 independent graphs that start and end at different points::
Below I imported the data into a spreadsheet, separated it into different columns and plotted the graphs:
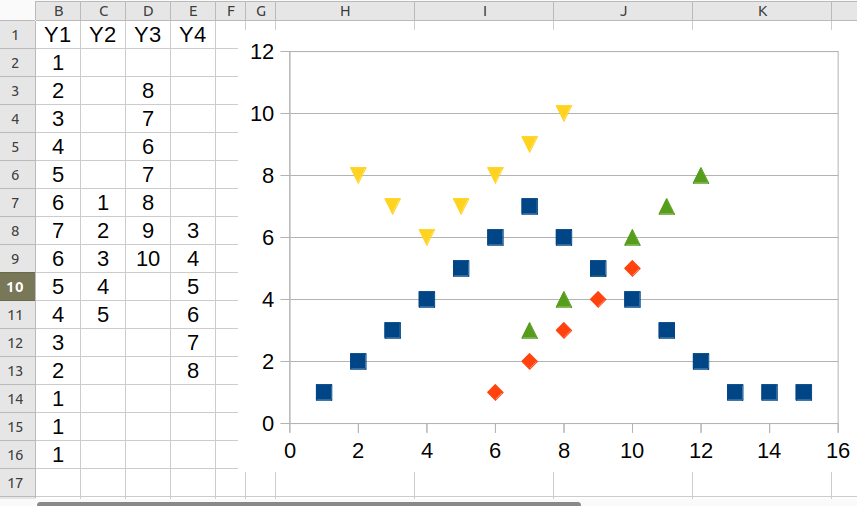
In PureData, is there a way to read a txt file of this type file and plot the four graphs on the same canvas?
test_graph.txt
Thanks,
a.
 posted in technical issues
Iannix, Open Sound Control, Arduino.
Hello everyone, I have a question, i want to start performing with my sound drawings live; my sound drawings are reproduced with sine waves, I use Iannix for composition and Pure Data reproduces the score. But for live performance it ocurred to me to reproduce them with police sirens. Iannix communicates with Pure Data through Open Sound Control. Arduino does not support open sound control directly, there must be a bridge that converts open sound control to serial data that arduino can understand, i researched and that bridge can be pure data, (i could make the police siren through arduino).
My question is if arduino can reproduce the iannix curves just like pure data does, that is, reproduce the iannix curves exactly like they are written, i use iannix curves mainly for composition, these curves can play separate notes or glissandi...
I use open sound control and sine waves because that is the only way to reproduce the iannix curves exactly the way they are written (midi does not follow the curve exactly, osc can, and i enjoy the sound). (the curves can be in any direction and last as long as i want with any kind of shape, acceleration or slowing down, and open sound control and the sine waves can follow them perfectly, but not midi)
So... I am willing to learn how to code for arduino if it can reproduce my scores the way they are written (just like pure data has done), i gotta feeling that it is possible, but before buying an arduino card i want to know for sure.
Here is an example of a iannix score:
So iannix would send open sound control to pure data, pure data would convert open sound control to serial data and arduino would receive the serial data and play the score through a speaker.
can this be done? thanks.
 posted in technical issues
How to use the bezier option in an array?
Arrays have an option to generate a bezier curve. In the attached patch, seven points are put into an array and displayed as a bezier curve. It looks nice, but does it have any function? When you read the array, you just get the points you put into it, not the points on the bezier curve. Is there a way to use the bezier curve as a wavetable or envelope, instead of the original seven points?
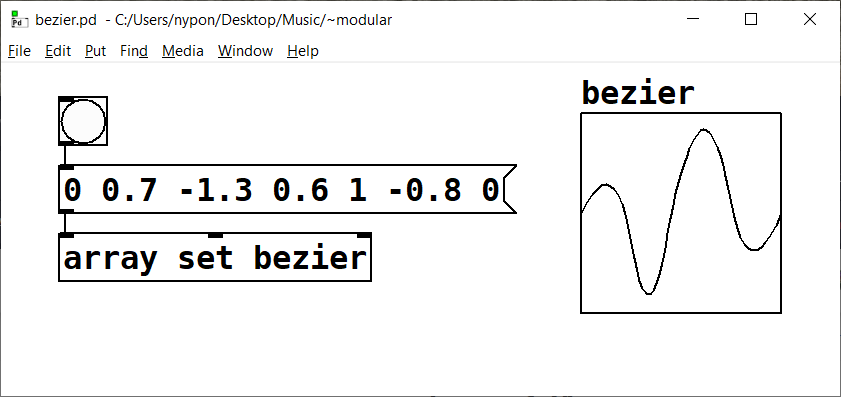
bezier.pd
 posted in technical issues
PlugData GraphOnParent not showing the controls in parent patch
Graph-on-parent is fine in PlugData. (Editorial comment: PlugData is a much-needed effort to move Pd's UI away from three-decades-old standards... assuming that it's wrong just because it's new IMO contributes to stasis, which is not healthy for the platform.)
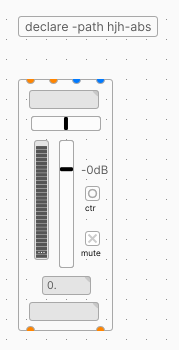
The problem is in the structure of your patch.
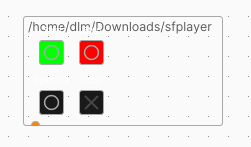
sfplayer.pd is not a graph-on-parent patch. I can see this by opening it in regular Pd, and right clicking on the empty space --> Properties. The graph-on-parent property is not selected at the top level. So there is no reason for either Pd or PlugData to display it as graph-on-parent, when it isn't.
Inside that patch, you have a graph-on-parent subpatch. This is misleading you into thinking that you have done graph-on-parent, when you haven't. (But then, the GUIs are not in the subpatch either!)
Now, I do see an unfortunate limitation in PlugData: I don't see right away how to get to the graph-on-parent property. I expected right-click empty space --> Properties to show the canvas properties, but it doesn't. AFAICS then, to create a graph-on-parent abstraction, it looks like you will have to use normal Pd first.
Here is sfplayer with graph-on-parent defined at the top level.
hjh
 posted in technical issues
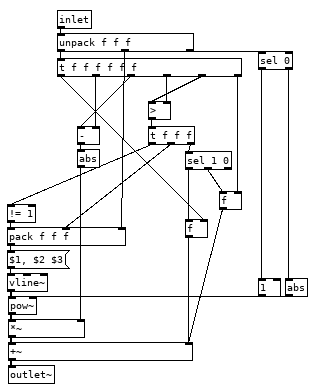
ways of exponentiation ( / range mapping)
@cfry Way back when I had no real clue what I was doing I did this programmable curve Should give you a starting point. I did not understand what [vline~] did back then, it would simplify things and there is no reason for that big [expr] but I had not quite figured out order of operations yet and that is the only way I could make it work.
Edit; I went ahead and fixed it up a bit. Here it is without the input timing stuff. Just send it a message of target value, duration and a power 0.5 for log, 2 for expo and anything between or further to the extreme for steeper or gentler curves. [1 1000 2( would give an expo curve ramping too 1 over 1 second. Remembered that I did not use [vline~] because still need to time the curve value and scaling.
curver~.pd
Edit, fixed some silliness, probably still some more in there.
 posted in technical issues
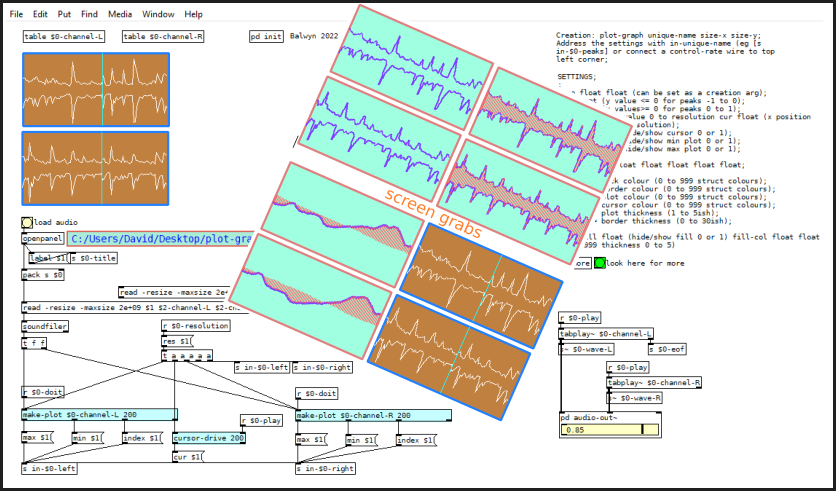
plot-graph - a way to display waveforms
Here I've uploaded plot graph as an abstraction plus two other abstractions to assist in its usage make-plot and cursor-drive
plot-graph creation: plot-graph unique-name size-x size-y;
Address the settings with messages to in-unique-name (eg [s in-$0-channel-L] or connect a control-rate wire to top left corner;
make-plot creation: make-plot array-name plot-resolution;
eg [make-plot $0-left-channel 200]
make-plot is used to take the audio file size given by soundfiler and divide that by the x resolution of the plot-graph window, read the array in chunks of the min max amplitudes to plot the waveform.
cursor-drive creation: [cursor-drive x resolution] eg [cursor-drive 200] drives the play cursor if active
For best results I found it best to keep the resolution to half the window size, say 200 window 100 resolution
SETTINGS. for plot-graph
size float float (can be set as a creation arg);
min float (y value <= 0 for peaks -1 to 0);
max float (y values>= 0 for peaks 0 to 1);
index float (x value 0 to resolution cur float (x position for cursor 0 to resolution);
cur-vis float (hide/show cursor 0 or 1);
min-vis float (hide/show min plot 0 or 1);
max-vis float (hide/show max plot 0 or 1);
colour float float float float float float;
where:-;
float 1 = back colour (0 to 999 struct colours);
float 2 = border colour (0 to 999 struct colours);
float 3 = plot colour (0 to 999 struct colours);
float 4 = cursor colour (0 to 999 struct colours);
float 5 = plot thickness (1 to 5ish);
float 6 = border thickness (0 to 30ish);
plot-fill float (hide/show fill 0 or 1)
fill-col float float (0 to 999 thickness 0 to 5)
For an animated plot with fill try the following in the plot-graph-help
load audio file
click 100 resolution
click look here for more
scale x using the number-box to 200
toggle off min-vis and cursor-vis
click play (and loop if a small file)
in the more page
toggle scope plot
toggle fill plot
adjust normalise
play with the colours
plot-graph.pd and plot-graph-help.pd are read only to prevent overwriting the defaults, change this if you wish
Have fun
Cheers
Balwyn
plot-graph.zip
The picture is reduced to 70%
 posted in abstract~
tabwrite
Thank you.
Going back to the question of overlapping graphs, in this sample patch I would like to overlay 10 graphs of random numbers:
What I was looking for, was to use a single array message like:
[s array $1 (
passing the values to $1 from a [counter] ...but I haven't been able, it doesn't work.
So in that patch I created an object for each array in this way:

Same thing for messages to clear graphs, I was looking for something like:
[; array$1 const 0 (
but it only worked by creating one for each array.
If the graphs were 100, it would be difficult to do all this.
Regarding the quality of the graph: I have seen that no points are created but segments (evident in the image of your last post).
So, to draw a point cloud, remaining in pure data, soon I'll try with "data structures" , using for each point a circle of minimum possible radius. I just started reading some tutorials.
Otherwise of course I export the data (x, y, z) and use an external software. But I'm curious to see what I can do by always remaining in Purr-Data.
P.S.:
Purr-Data, when I use [prepend something] it always gives me a warning that says:
[prepend]: this object is a legacy replacement for prepend in cyclone library that is considered deprecated in pd-l2ork. Please use [list prepend] and [list append] instead.
So I should replace a single object with two objects:
[list prepend something]
|
[list trim]
In the patch above I tried to do this replacement, and it no longer gives me the warning.
It seems to complicate things.
Bye,
a.
posted in technical issues
IanniX glissando
@atux The OSC data you get from Iannix (on port 57120?) includes the curves.
separating them from the other data depends on whether you are using the MrPeach library so [route /curve] or for vanilla [oscparse] >>> [route curve]
[route /curve /trigger] or [route curve trigger] will give you both curves and triggers.
You will probably need the transport messages too so as to stop playback when you stop playback in iannix so [route curve trigger transport]
Then unpack the curve data [unpack s f f f f f f] and I think the 2nd 3rd and 4th outlets are xyz.
Actually you will probably need a timer in Pd...... "I have not received a coordinate in x mseconds >> stop sound" to kill the glissando when the curve ends.
Maybe you have to tell iannix to send the curve data....... I can't remember.
David.
posted in I/O hardware diy