Permutations, second part, can anybody get this patch to work?
@Ale-H.H. I am out tonight..... so no help I'm afraid.
I start to understand.
You can assign curves to what you wish....... so?
Anyway.... the last patch allows you to draw curves for each oscillator controlled by just one iaanix timbre curve.
You just have to decide how each oscillator should respond to that curve to create the timbre.
If you want the first oscillator volume to simply follow the iaanix curve then draw a line in "a" from bottom left to top right.
If you want the last oscillator to do the inverse then draw in "h" a straight line from top left to bottom right.
If you want the second oscillator volume to rise quickly as the iannix curve goes to 0.5 and then fall back to zero as the iannix curve reaches 1 then draw a triangle in "b"
I hope that makes sense.
David.
 posted in technical issues
Permutations, second part, can anybody get this patch to work?
@whale-av Hello David!, I dont understand, if there are 8 curves in pd already manipulating the sine waves´s volumes, then why a curve in iannix? with my last teacher he told me to draw in iannix a curve for each volume of an oscillator, and i didn't like the idea because i want only one curve per parameter, and the more curves the less space i have in the score(I want a lot of voices in my scores and have written down 16 parameters for each, so imagine having only one voice having 16 parameters), plus with [combinations] you only need one curve because all the possible combinations are already set, and with time i would try or intuitively memorize some of the combinations and i would know where to go vertically on the score for a sound that I like. In my lifetime i want work and reach 64 sine waves´s volumes, that is way more(way more, way more) than enough, with eleven volume percentages: 0, 10, 20,30,40,50,60,70,80,90,100, isn't there a way to load the list only once and work from there? maybe right now the 64 sine waves will not occur, but gradually getting there.
here is the hypermorph ( https://www.ableton.com/en/blog/hypermorph-sonic-faction/) at 1:13 you could perceive the morphing, what we are doing is hopefully a lot more radical, they only use 4 sound sources for morphing, the combinations we are doing are a lot more...
 posted in technical issues
Permutations, second part, can anybody get this patch to work?
@whale-av curve 4 will control the list of all the possible combinations of the 8 sine waves´s volumes, curve 4 controls the list, and curve 3 controls the pitch of the curve,
so you have 2 curves, one for pitch and one for ITS timbre
ok so maybe curve 4 goes in the subpatch right? right where it says "r timbre"?
posted in technical issues
Permutations, second part, can anybody get this patch to work?
@whale-av Hello ") !! I have a lot of questions... what does 0-255 represent? what is this range? and where would the curve 4 enter? Because now it says "s timbre", isn´t there a way to connect curve 4 to an inlet that moves the whole combinations of the list? the curve works from 0 to 1, maybe making a proportion of the whole list of 0 to 1, or equaling the whole list to 0 to 1 and then "box" the list and then connect the curve to it´s inlet... by "box" i mean closing the list and then connecting the curve to it´s inlet, once it can identify any combination between 0 and 1.
!! I have a lot of questions... what does 0-255 represent? what is this range? and where would the curve 4 enter? Because now it says "s timbre", isn´t there a way to connect curve 4 to an inlet that moves the whole combinations of the list? the curve works from 0 to 1, maybe making a proportion of the whole list of 0 to 1, or equaling the whole list to 0 to 1 and then "box" the list and then connect the curve to it´s inlet... by "box" i mean closing the list and then connecting the curve to it´s inlet, once it can identify any combination between 0 and 1.
Like for example a curve for intensity, i would just connect it to the amplifier´s right inlet and the curve would control its volume...
I think that if this works, this would be a new way of morphing instead of just morphing 2 or 3 sounds... this would be a morphing of any quantity of sounds.
yeah 8 sine waves with 4 volume percentages each is a lot, I imagine a super radical morphing timbre 
I imagine writing everything in iannix without having to move anything manually in pd, so if i write in iannix a curve that starts at the top, the list on pd would set the volumes of the 8 sine waves with whatever combination is at the top of the list.
posted in technical issues
Permutations, second part, can anybody get this patch to work?
@Pándinus I am not understanding.......
What are the strings from /curve and are they relevant apart from the midi note?
/curve 3 s f f f f f
/curve 4 s f f f f f
and how do you want to use them?
Or do you manually set the oscilator volume values for each /curve 3, /curve 4 etc.?
Does this have anything to do with your other thread? aaaa, aaab etc.?
Where does aaaa, aaab etc come from (I assume those are going to control the volumes..... and at what time do they arrive and what triggers them?
[combinations] would send them a rapidly as it can so your whole curve would last a few milliseconds...
David.
posted in technical issues
5 Band Equalizer with Bezier Controller (eq5_mey_w_bezier_sv.pd) (updated to 8-band below)
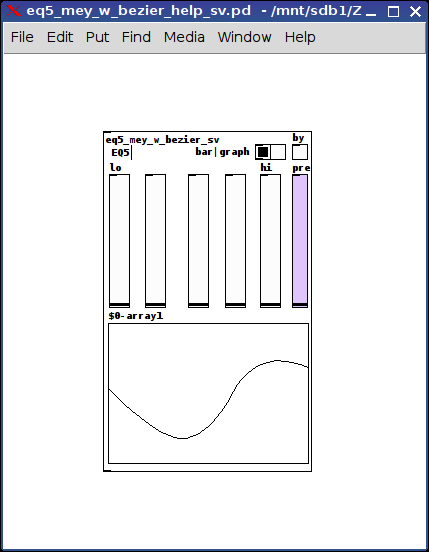
eq5_mey_w_bezier_help_sv.pd
eq5_mey_w_bezier_sv.pd
Really I just wondered if it could be done.
But it turned out pretty cool, so am going to share it.
-Simple 5-band eq
-With bezier-curve control feature (with this, it is vanilla only)
-Select bar or graph to change which way you change the eq
Info: if you have select "graph" then Be Sure to use the graph or the controls will just reset to where the graph shows them to be.
more than anything, it's just a pretty, cool way to show this technique.
peace.
-svanya
note: the original eq5 is from: @mariomey : thanks, Mario, I use your patch alot. -Good wishes to you, sv
 posted in abstract~
Dynamically creating arrays
"graph" is just a [pd] sub-patch with the Graph on Parent option turned on. This is like an empty container where you can put an array into (using the "put array into last graph" option) or anything else you want.
As far as I know, there are three (plus one) option for storing arrays:
-
"Array" from the put menu. This stores the data in a graph, which you can draw manually.
-
the "table" object, ie. [table sound1]. This is basically an array but in a closed sub-patch, saving on CPU power as discussed earlier.
-
the new "array" object in Vanilla 0.45 and higher, ie. [array define myarray], distinct from the "array" in the put menu. This functions more like [table], but has the additional functionality of [array get], [array set], [array random] etc. (see the helpfile for information on this). Like table, if you click on [array define], you'll see the graph, but you won't have access to the familiar options (points, polygon, etc).
All three of these objects can be written to and read from using the same tabread and tabwrite objects, and there's no difference between them that I know of in terms of playback. I think that the put menu "array" is the only one that will allow you to save the contents in the patch, though.
It might seem strange that there are three versions of roughly the same thing, but the explanation is probably that they were created at different times. Instead of replacing and updating old and obsolete objects, which tends to render old patches as incompatible, Miller likes to make new objects and leave the old ones in place.
The "plus one" method is to store arrays in data structures, but this is pointless for what you're doing because a: it's very difficult and b: these arrays can't be read and written to by tabread/write objects.
 posted in technical issues

graph clipping
@whale-av: It seems more likely that the graph and garray code was written first, without realizing that clipping was needed.
Consider:
- It's not just the dependent variable (i.e., y position) which can fall outside the bounds of the graph. If you try to change the x range for a 100-element array to be between 50 and 60, for example, the array will extend well past the graph's horizontal boundaries, too. So the dialog makes it seem like you can set the graph to view only a portion of an array when in fact that's not true.
- Even for y-values, it's not just that they can be shown above or below the graph. For extreme values they can fall well beyond the canvas viewport, causing the vertical scrollbar to shrink so small that it becomes difficult to navigate the canvas anymore.
- Even if you clipped the garray to fall within the left and right bounds of the graph, data structure arrays on a GOP will continue to be a problem because the user can set the x value for each element independently. But when they extend beyond the GOP you run into other problems, like failing to react to mouse events, or not getting redrawn properly.
It's difficult to address a lot of this because garrays are entangled in the data structure code for [plot]. So a fix in one area is likely to have unforeseen side-effects for the other.
 posted in technical issues
Bezier Curve accomplished
Hi,
did you know my abstraction [jmmmp/bezier]? It does a 4-point cubic bezier
curve, with several other features like parameter export and recall. With
0.43-ext comes the control version, probably in the next edition the
signal version will be there as well. But I send both here.
I also wanted to do a version with unlimited segments, but I didn't find
the math for it yet (it's not the same as calculating one segment after the other using the same formula), and also it's not that trivial to program it with data structures. The best would be if someone would make a real external using a tcl/tk gui, but that might not happen that soon.
João
 posted in patch~