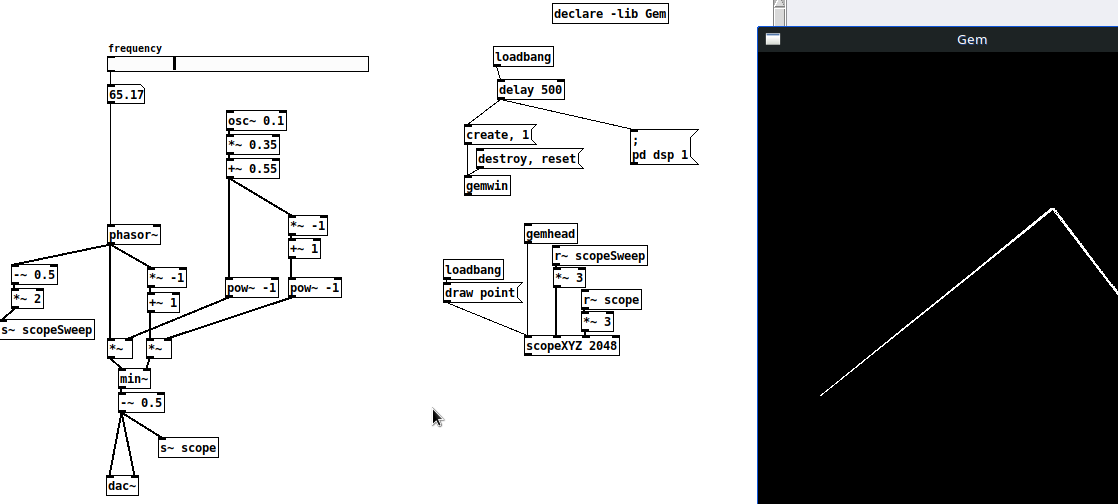
Disclaimer:
I'm a musician, just installed Pd a few weeks ago and quickly realised that I need to better understand the underlying math of it all.
The small idea:
I'm learning Pd by reading help files and the manual while trying to build a synth where I can change the shape of the osc~ wave via AM, FM and folding. This part is going great so far.
The big idea:
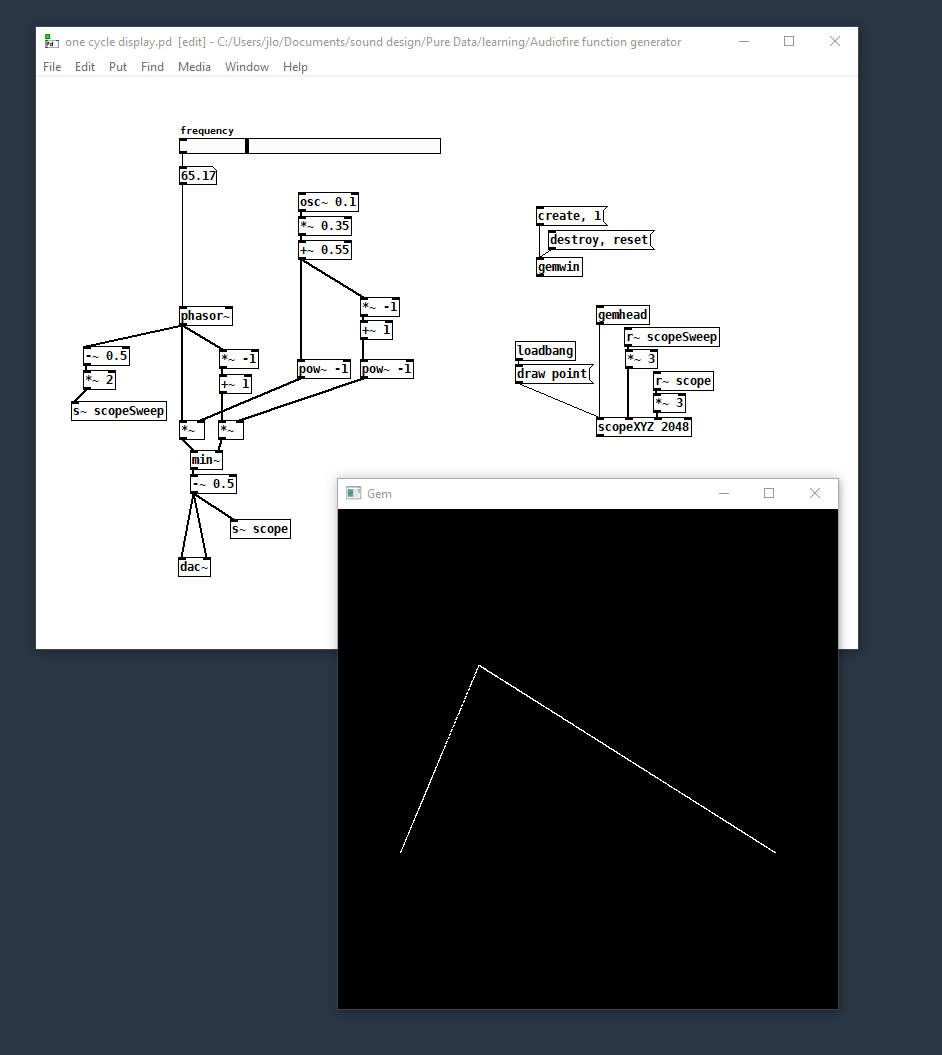
I wish I could display the wave form and how the shape changes while being modulated, folded, clipped, etc... It's useful, plus super fun!
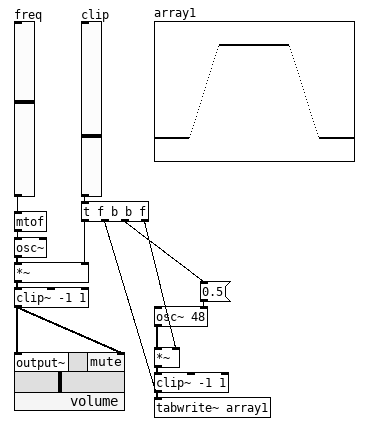
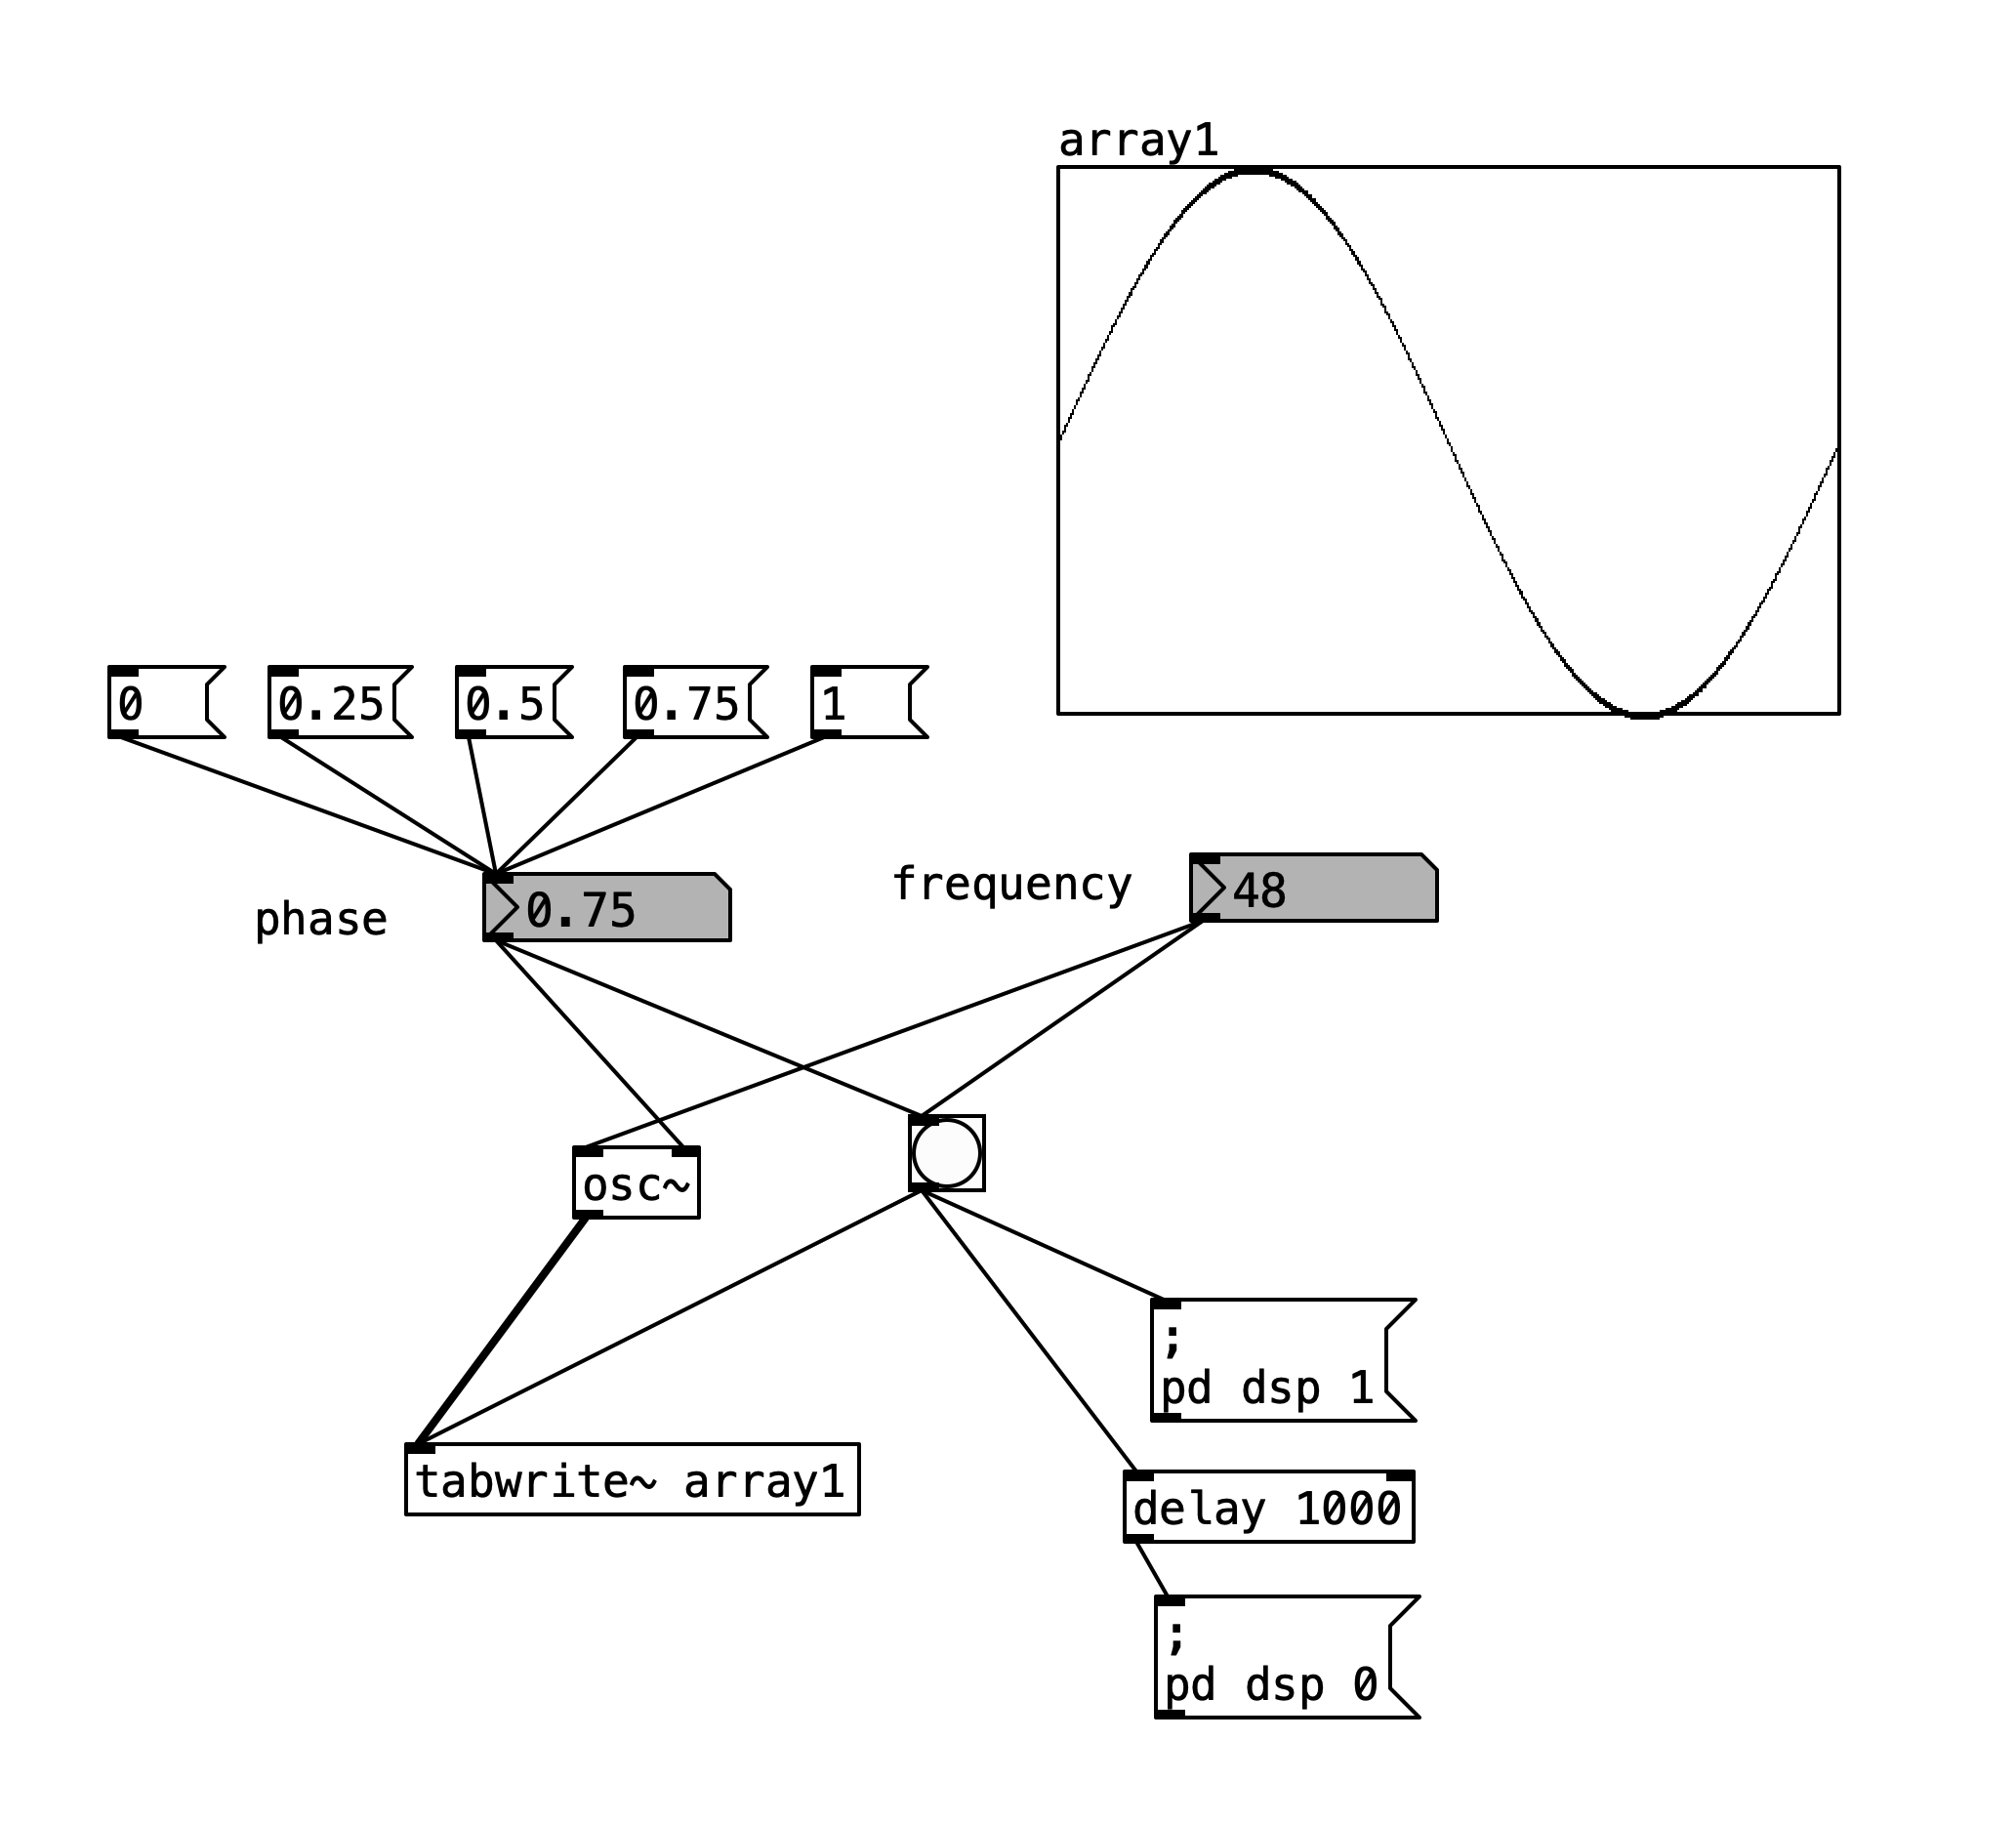
However, I thought of a "static display" that shows only one cycle of the wave. It works "fine enough" if the frequency is 48 and the size of the array is 1000, but as soon as you change the frequency it starts showing more cycles or less, as one would expect, of course.
The questions:
- It works at these values (48hz and size 1000) because my sample rate is 48k. Is this correct?
- Is there a way to do what I want? If so, what would you advise me to study?
Note:
I've got the inspiration to do so after using Glänta, a M4L device by Fors. I don't know how they do it, but the visual aspect of their devices is usually customised with JS stuff. I don't believe that is a "true" wave, but an animated representation of it. But again, don't quote me on that, it's just a hunch (;
Files:
- a Pd patch with an example of the display idea mentioned above
- a txt file with the array values as list. You can see that is not perfect, but close enough (;

