Hearing Loss Simulation
@Azoso Hello and welcome to the forum.
It can all be done of course.
I would recommend starting with an installation of Pd extended if possible, rather than Vanilla, as at least one of the tools that you need (spectrum analyser) is then immediately available in the download.
If you are using a recent 64-bit mac os then that will not be possible, and things get more complicated.
You will then need to use "help" "find externals" from the Menu of Pd and download all the externals.
You can always switch to Vanilla later when you know more about the workings of Pd "under the hood".
The spectrum analyser (probably the most difficult part of your project) can then be created instantly by placing an object [spectrogram~-help] in your patch. Then right-click it to open it.
You can see it working by connecting an [adc~] to the [spectrogram~] object instead of the [noise~] object...... and you will be inspired to continue.
Then change [spectrogram~-help] to [spectrogram~] so as to use it in your patch.
Come back when you get stuck!
David.
 posted in technical issues
FFT analysis in wav files
Hi, guys!
I'm relatively new to Pure Data and I'm making a visual project — with Pure Data (Purr Data version) and Processing — that depends on a good FFT analysis.
I've been trying to solve this problem for some time now.
I made the patch that is in this tutorial:
This patch opens a file and "draws" the left and right channels on two arrays.
I'm trying to mix this patch with the "patches/3-8-1-1-rfft-array.pd" of this tutorial:
http://www.pd-tutorial.com/english/ch03s08.html#id431716
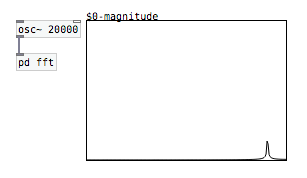
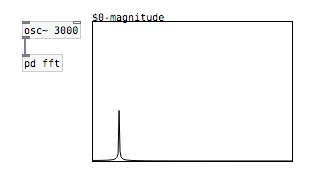
So, what I'm trying to do is to make an FFT analysis to an wav file to represent visually the amplitude of each range of frequencies from the lower frequencies to the higher frequencies for different songs.
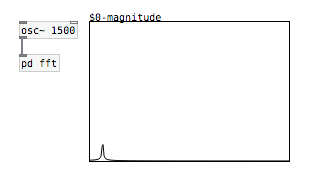
When I test the FFT analysis with an [osc~] object (writing it in an array), everything is kind of fine: 10000Hz in the middle, 20000Hz glued to the right. But I noticed that when I put [osc~ 0], the amplitude glued to the left is really high. Same with 50Hz, 100Hz, 150Hz, etc.. until around 1500Hz. Another thing I noticed is that each frequency has a different amplitude.
So, one thing I tried to do: I put the FFT code in a subpatch and changed the blocksize inside it to 4096 with the object [block~]. Since only the first 32 bins shows the frequencies, I put the size of the array with half the blocksize: 2048. Then, since the main frequencies of the majority of the songs goes until around 5000Hz — I've been told that C8 correspond to around 4200Hz, and that would be in the 7th bin in a block size of 64 —, I tried to reduce the size of the array to 512:
20000 (total frequencies) / 2048 (bins) = 9,76 (frequencies per bin)
5000 (frequencies for songs) / 9,76 (frequencies per bin) = 512 (bins)
In a blocksize of 64, this would correspond to the first 8 bins.
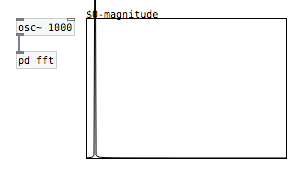
But still, after all this, the frequencies are always glued to the left:
I've tried everything to make a well-distributed FFT analysis, like it should be, but it's ALWAYS glued to the left with all the songs that I tried with...
Sorry for the long post and let me know if I wasn't clear in my question...
Thank you in advance!
 posted in technical issues
Write values to Array-indexes sequentially over time - creating a timeline
@Jocketor I mean that it can be done very fast as an analysis once you have all the data in an array..... so if you load an audio file into an array... or you have written a live input to an array..... then the analysis will be much quicker than doing it "live" in the audio domain where you are waiting all the time for audio blocks to complete their processing.
Do you want to show the user the results "live" while they are recording the audio..... is that why you want to use audio objects for analysis?
If you want amplitude values during a "live" [adc~] recording you can use [env~] to output those values (although in dB) at the end of each audio block (or set a wider..... or a narrower window if you wish for [env~]...... right down to a single sample if you set the block size to 1).
David.
posted in technical issues
Write values to Array-indexes sequentially over time - creating a timeline
@whale-av Yeah - i've also started experimenting with using phasor (well, phasorshot really) to read the signal using tabread4~ instead of tabplay~ which i use to analyse the signal in real-time. It all "works", but by using tabdump to print the values of the array after processing the wavfile I can clearly see that I get different values compared to when doing it in real-time. Somehow it seems that upping the rate of the phasor seems to make it go faster than how my plotting to the array can handle. I don't know if plotting using a faster metro would solve this. Again, might have to analyse in real-time, but doing it on smaller chuncks simultaneously to save time.
"Although having slept on this..... I guess it can be done almost instantaneously if you analyse the saved audio file outside of the audio domain." Could you explain what you meant there? Sorry, i'm slow. 
 posted in technical issues
Analyse envelope spectrum
Hi again guys. I was wondering how I could analyse the envelope spectrum of a signal, and find the peaks of this signal. What I am trying to do is to estimate the formants of speech by finding the peaks of the envelope spectrum in given frequency ranges, after the signal has been passed through [lop~] and [hip~], leaving only the desired frequencies to analyse. Currently, I am having to use [bp~] and [env~] to manually create these "peaks" (sort of like the fourier transform), like shown in the puredata tutorial website, but I was wondering whether I could create these partials dynamically and then get the frequency where the peak (maximum) occurs. I read a little bit about the [sigmun~] object, but I didn't quite get it and I can't really find any tutorials on it.
 posted in technical issues
FM Pre-Analysis?
Hello,
Does anyone happen to have a PD object into which you can input the Carrier Frequency, Modulator Frequency and Index of a Frequency Modulation, and get back a spectrum analysis, e.g. 4+ of it's loudest frequencies in Hz? I'm using Heavy, a platform for converting PD patches into plugins (for Unity, C, WWise, etc.), but it doesn't have (m)any options for pitch detection (not all PD objects are compatible), so I figure something like this would be the solution... but it's not simple due to FM's ability to produce infinite sidebands...
I looked up some info, but there's an omega symbol that represents angular frequency of the carrier in radians per second and I'm not sure how to get that value: http://www.radio-electronics.com/info/rf-technology-design/fm-frequency-modulation/spectrum-bandwidth-sidebands.php
http://literature.cdn.keysight.com/litweb/pdf/5954-9130.pdf
Any ideas?
 posted in technical issues
Super Mario Sound Effects Reproduction
And some bonus screenshots as a comparison of the Warp Pipe so you can see what i mean.
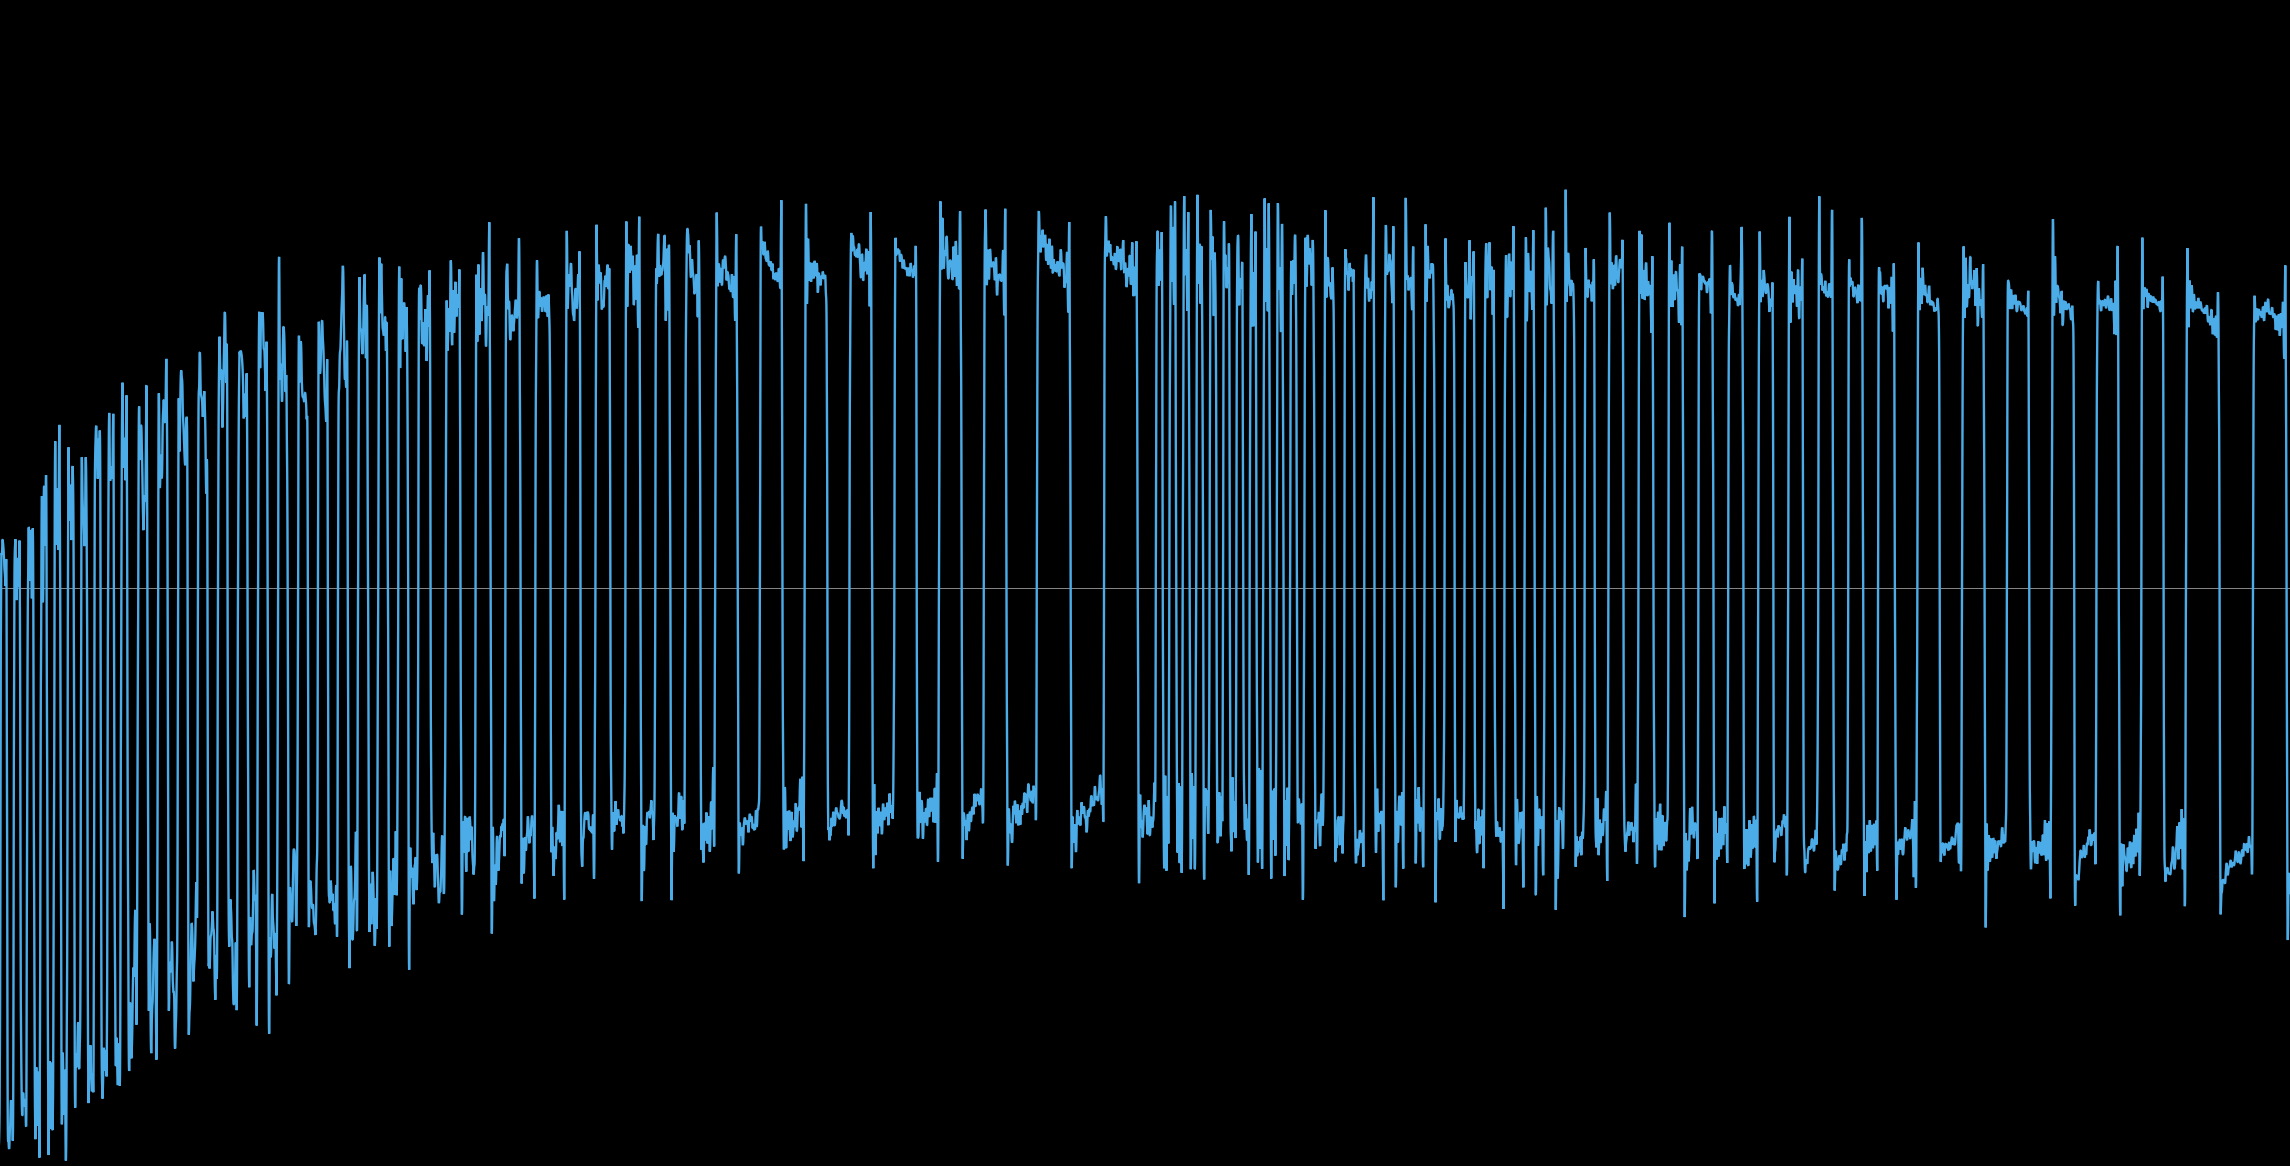
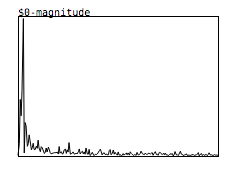
This first image is a snapshot of the waveform making up the warp pipe sample. You can clearly see note definition, duration, waveform and overall envelope.
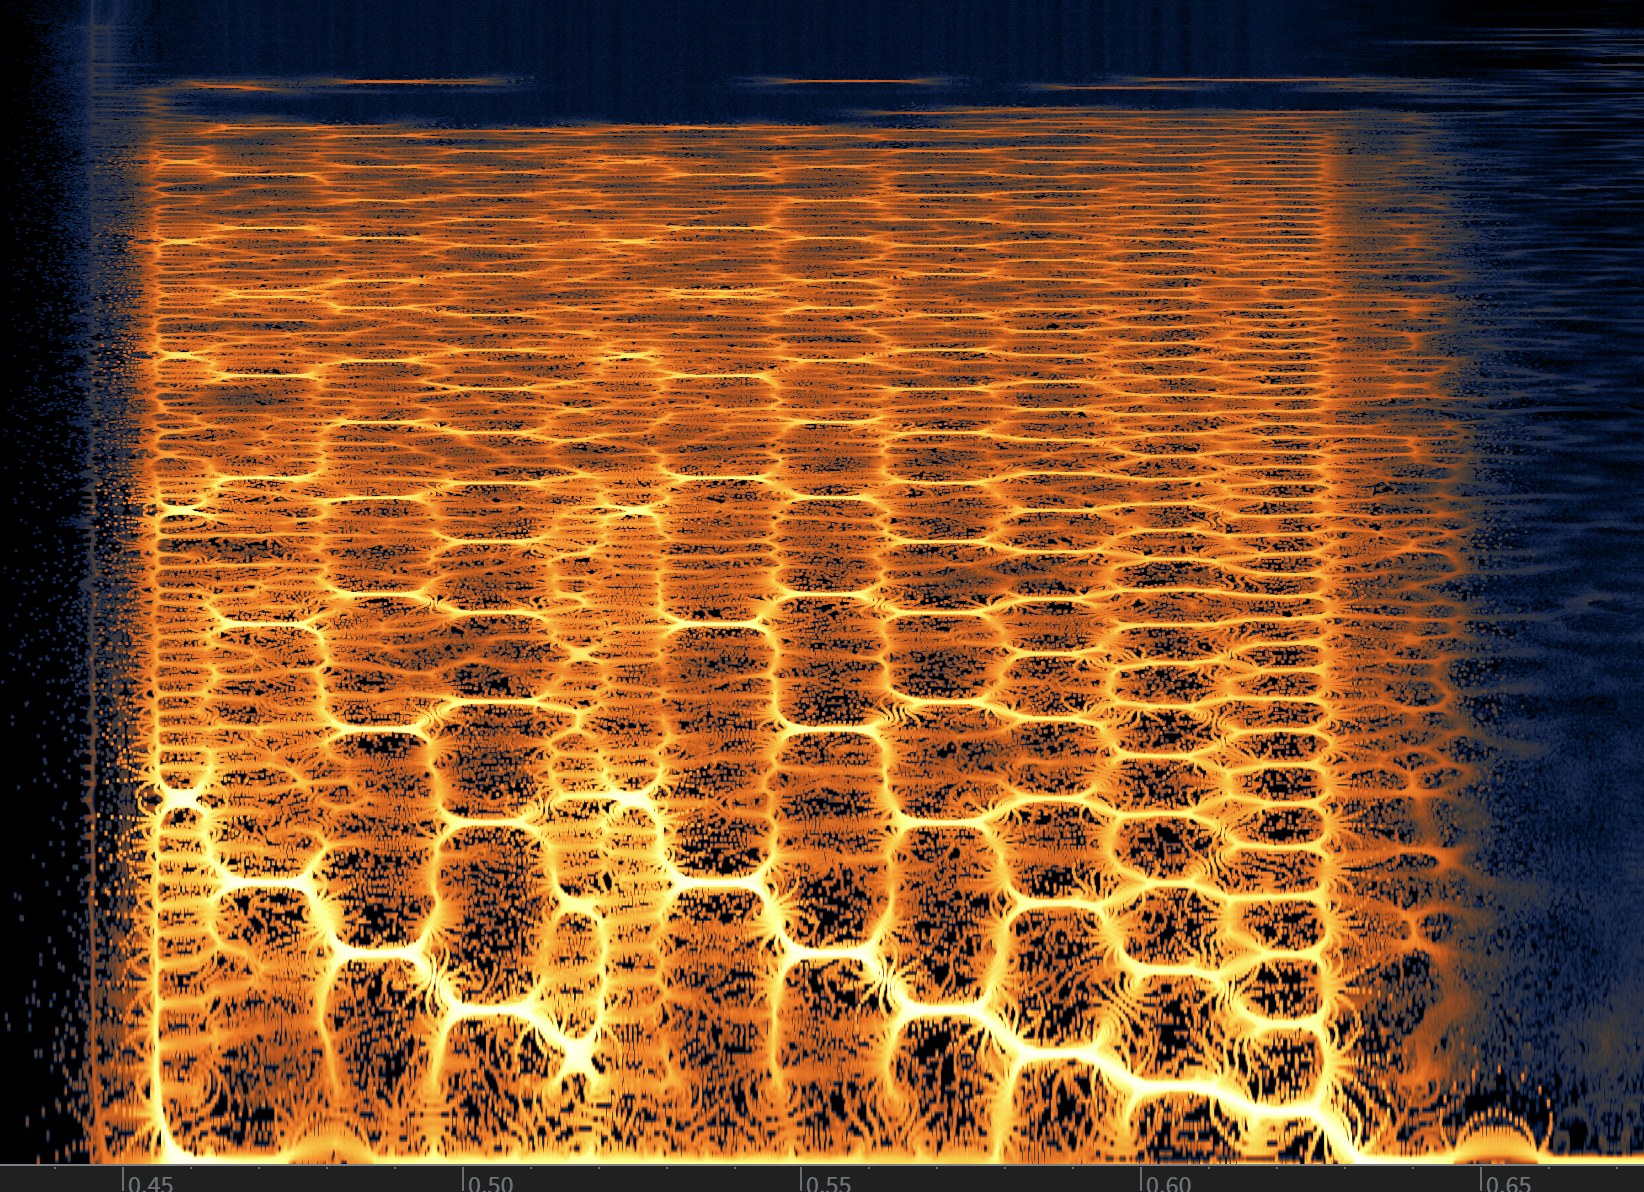
Here is the spectrum analyser for the same section. From here it's easy to identify root notes and their harmonics. The frequencies were mapped to notes so i could check for scales and anything else then converted to MIDI
And then here is the spectrum output of the Yoshi Mount effect in which i can't tell much except for some rough frequency sweeps and the possibility of it being AM from the screenshot in the above post.:
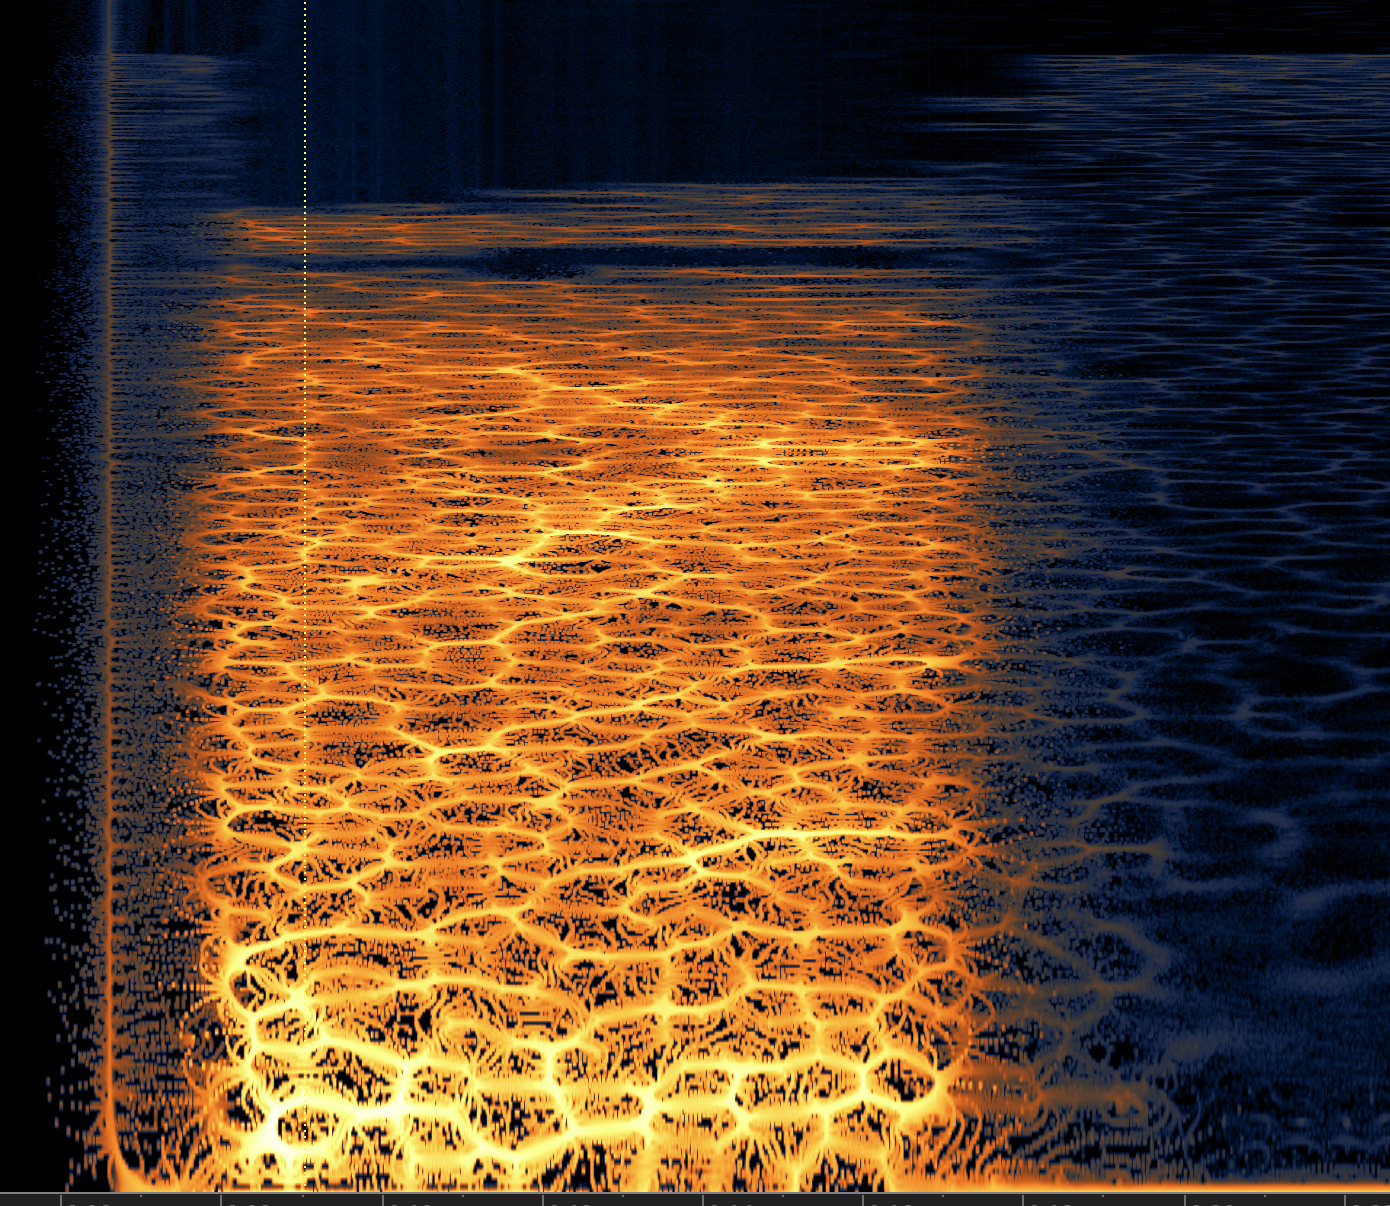
On a side note i love Izotope RX! it's fantastic for stuff like this (and yes, it's a legit copy) 
 posted in patch~
Casio CZ oscillators
so the objects [cz~osc saw] and [spectrum.mmb $0-spectrum] are not recognized, as well as a few others. i cant locate them in your library, and ...
basically im lost. af.
can someone explain it as though im a 3 year old chimpanzee?
EDIT
so ive found the spectrum one, but i have noooo idea how to download the files
from your library
EDIT
so ive figured out how to download your library, but i cant locate the cz osc one
(UGH i bet its another stupidly easy to figure out thing but im still stuck AAAARGH!!!)
EDIT (last one maybe? )
so i mightve figured it out... youve removed the cz oscillators altogether from your library?
i think im literally going to cry if thats so.
 posted in abstract~
Running your patches on Android usind PdDroidParty in 10 Steps
this is one hell of a useful app. really exciting. and deserves a lot of attention from the pd community...
i'm currently trying to make a multi-partial musical instrument tuner / spectrum analyser to run on my galaxy s2 so i can analyse and tune the overtones in xylophone/marimba bars. it'll never replace my strobe tuner, but the initial results are pretty encouraging ")
one question:
i'm having a lot of trouble getting a number stream out of a vslider object. if i set the vslider's send symbol to "foo" then try receiving the output in a vanilla number box (ie, not a droidparty numberbox) with receive symbol "foo", i get nothing. the patch works fine when run on my pc though.
is this a known issue?
 posted in tutorials
FFT freeze help
[rfft~]/[rifft~] makes the assumption that you only intend to work with real signals (i.e. no imaginary part). [fft~]/[ifft~] will work with real and complex signals (real and imaginary part).
With real signals, if you do a spectral analysis from 0 Hz all the way up to the sampling rate, you'll find that the spectrum between Nyquist and the sampling rate is a mirror image of the spectrum between 0 Hz and Nyquist. (When you think about it, it makes sense; a frequency above Nyquist will alias below to another frequency, so to a digital signal both those frequencies are really the same thing.) Since they are just mirror images, it is computationally pointless to calculate the second half of the spectrum after calculating the first half, because we already know it. So [rfft~] doesn't compute the frequencies above Nyquist, and [rifft~] assumes the spectrum should be mirrored and so doesn't calculate an imaginary part for the synthesized signal. In other words, they're more efficient.
Complex signals, on the other hand, may not have a mirrored spectrum. In that case, you need to use [fft~]/[ifft~] to calculate the full spectrum. Music signals are typically real, though, so for most situations it is best to use [rfft~].
Also, just to be clear, the real or complex signals I'm talking about here are in the time domain. In the frequency domain they will always be complex.
 posted in technical issues