
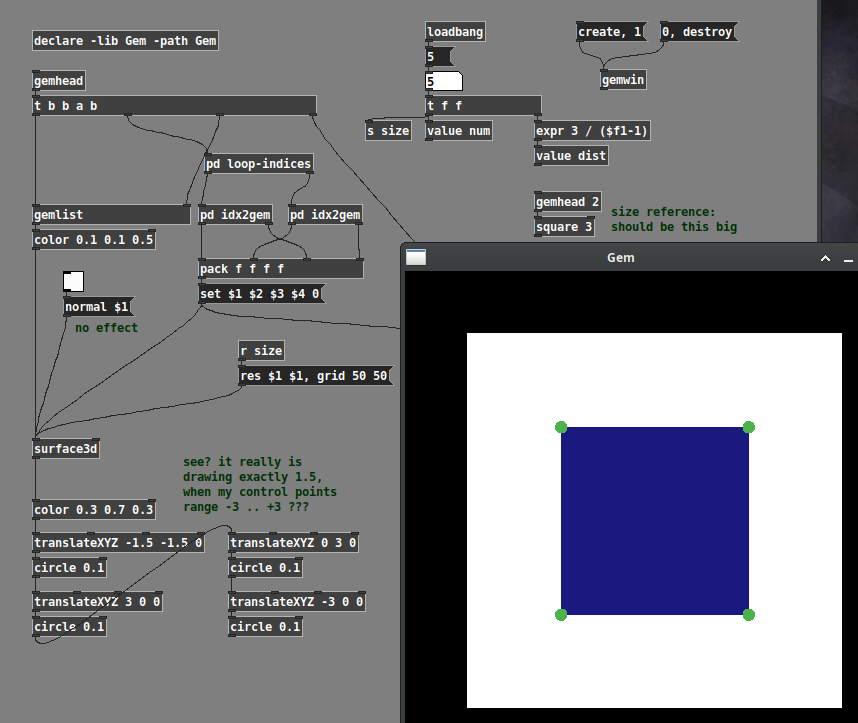
I'm stumped. I'm generating control points between -3 and +3 (z = 0), and it's drawing -1.5 to +1.5. The white square is -3 to +3. The green circles show where -1.5 and +1.5 are.
Anyone know why?
(I will be distorting the grid later, so the loop-generation of a control point grid is necessary.)
hjh

 -- a 5x5 grid with points at -3, -1.5, 0, 1.5, 3 draws half size, but a 6x6 grid draws slightly larger.