-
-
Still
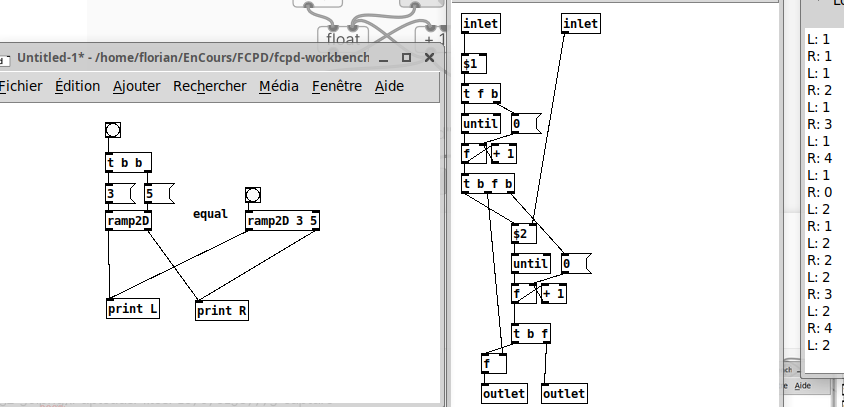
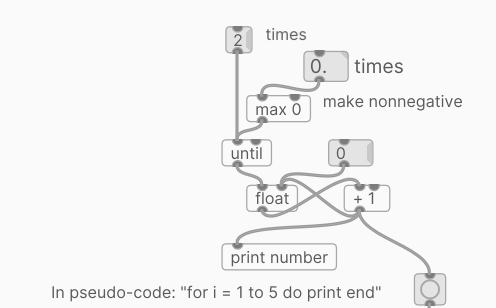
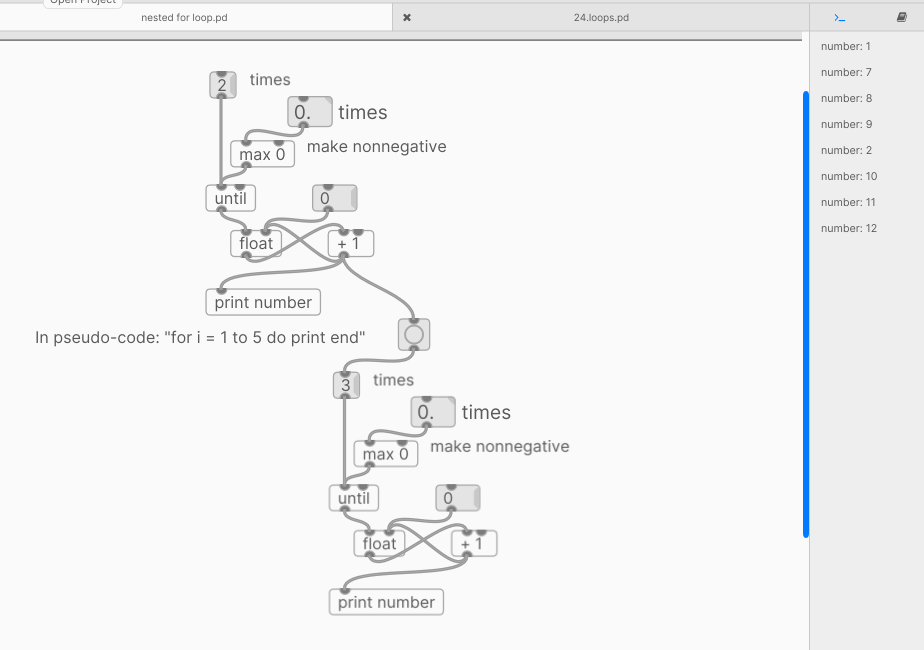
posted in technical issues • read moreHow to create nested For loops
Example:
for i=1 to 2
    for j=1 to 3

output would be / trying to get:
1-1
1-2
1-3
2-1
2-2
2-3
I tried this which works for the first For loop.
But it didn't work with the second For loop
-
posted in technical issues • read more
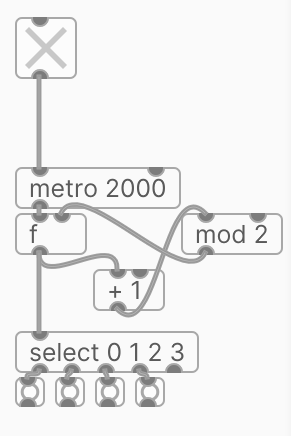
Increase bang hold time
I'm using metro and mod to repeat a sequence
I'm trying to have the bang hold (be on) for 2 seconds then be off for 4 seconds then repeat. I'm also trying to count how many times the loop runs. But got stuck on how to have the bang hold for 2 seconds.
What I tried.
-
posted in I/O hardware diy • read more
@oid said:
arduino meter kit,
Yes I find programming much easier and it produces less smoking components in my vicinity ;-D
-
posted in I/O hardware diy • read more
Thanks I'll have to research the circuit. I'll spend the $5 the issue is designing the circuit so it doesn't fry my computer
") some of coils have been shown to produce ozone (which is very high voltage).
some of coils have been shown to produce ozone (which is very high voltage).an example
-
posted in I/O hardware diy • read more
@Still said:
I was wondering if there are any examples of using PD to take images from a USB camera every 3 seconds or so and saving the image out to individual filenames that includes the time stamp in the filename.
My goal is to create a poor mans DAQ (data acquisition) using PD, a multi-meter, and image recognition.
My thought process:
PD plays audio signal that increases over time for a duration of 3 second, then appends the signal value that was played to a text file with a time stamp.
Have usb take camera shot every 3 seconds of a digital multi-meter screen and output that to a file with the time stamp in the filename.
Use machine learning / OCR on image files and append the decoded OCR numerical data to another text file that includes a time stamped text value from the filename so I can sync up the original signal played and the value that comes from the multi-meter output.
Plot the values from text file showing input signal vs output signal
PS I'm using Ubuntu 20.04 Linux.
If anyone has another way of doing this please let me know.Thanks
@whale-av said:
@Still What is the multi-meter reading?
If it is an audio level then you could bring the data back into Pd from a microphone and plot the level against the level of output from Pd.
Image capture could be done in Pd with GEM but the data will be huge and OCR is not a Pd function that I know of.
Using a microphone instead would bypass those stages....... and the plot could even be presented in real time.
David.It's a voltage level around 200+ volts. It's measuring non-linear vortex inductor coils. When you input different audio signals it outputs very high voltages and very low voltages .1 to 200+ volts (very non linear). So I don't think I could bring that data back in easily. I would do the OCR using python or Octave.
-
posted in I/O hardware diy • read more
I was wondering if there are any examples of using PD to take images from a USB camera every 3 seconds or so and saving the image out to individual filenames that includes the time stamp in the filename.
My goal is to create a poor mans DAQ (data acquisition) using PD, a multi-meter, and image recognition.
My thought process:
- PD plays audio signal that increases over time for a duration of 3 second, then appends the signal value that was played to a text file with a time stamp.
- Have usb take camera shot every 3 seconds of a digital multi-meter screen and output that to a file with the time stamp in the filename.
- Use machine learning / OCR on image files and append the decoded OCR numerical data to another text file that includes a time stamped text value from the filename so I can sync up the original signal played and the value that comes from the multi-meter output.
- Plot the values from text file showing input signal vs output signal
PS I'm using Ubuntu 20.04 Linux.
If anyone has another way of doing this please let me know.Thanks
-
posted in tutorials • read more
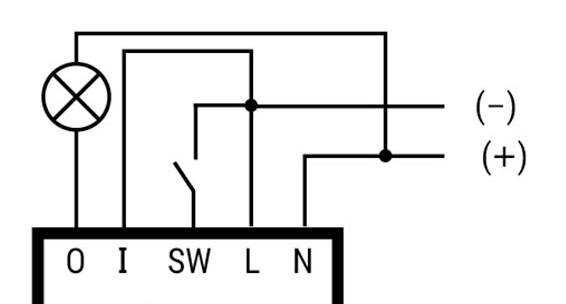
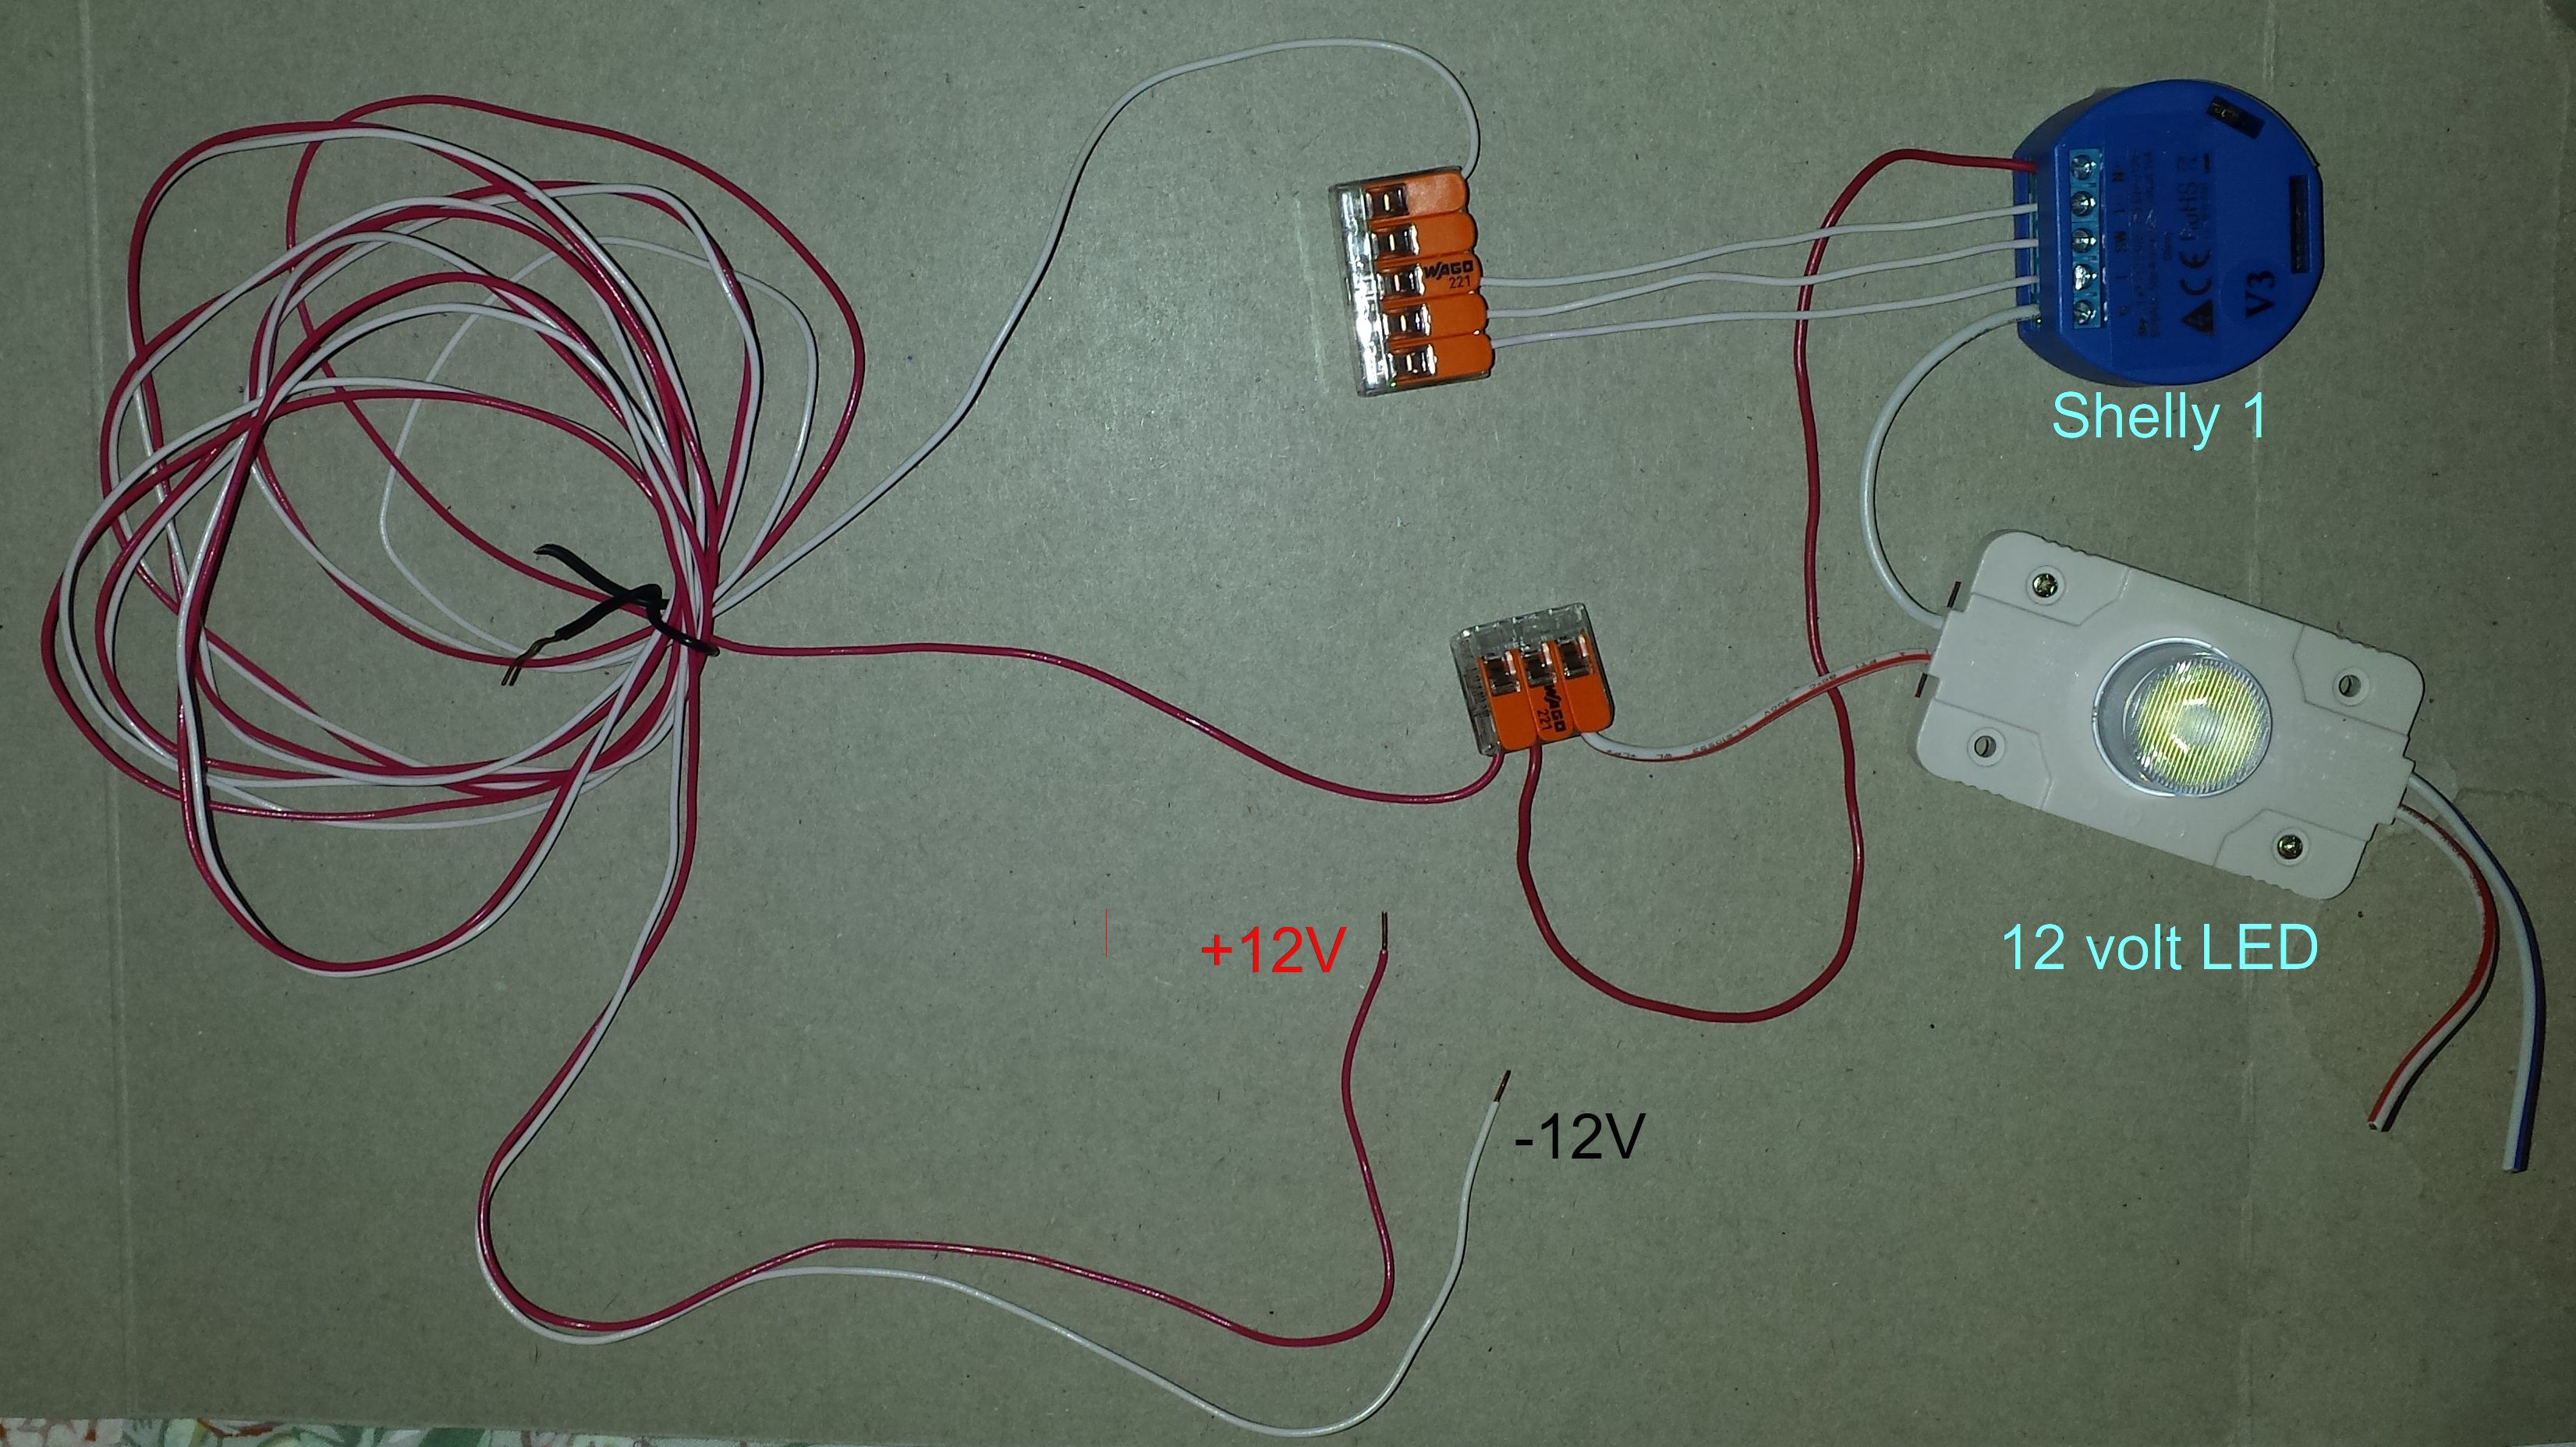
Getting Shelly 1 device to work with PureData and MobMuPlat
Here's the Pd along with a picture attached of how to get the Shelly 1 to be turned on using Pd Vanilla. Here's a link to the product https://shelly.cloud/shelly1-open-source/ . You could also use mrpeach which would make it easier but I could only use Pd Vanilla.
All credit goes to the people on the Pd List IOhannes m zmölnig, Jack, Mrpeach, the Shelly 1 facebook forum and a host of others
The Pd for turning on and off a couple of Shelly 1's which are connected to a musical Tesla coil, a pump, and a ultrasonic mister.
I'll be using MobMuPlat to control all of this from my tablet this will allow my laptop to do all the CPU sound generating intensive stuff. Someone made a good tutorial that explains this links below.
I'll place the completed project on (at the moment the first test version is up but I'll be putting a different design up next )
https://stillpointx.wordpress.com/research/modulated-plasma/Here's the pd file
test_netsend_shelly1_on_off_toggle.pd