
Hi,
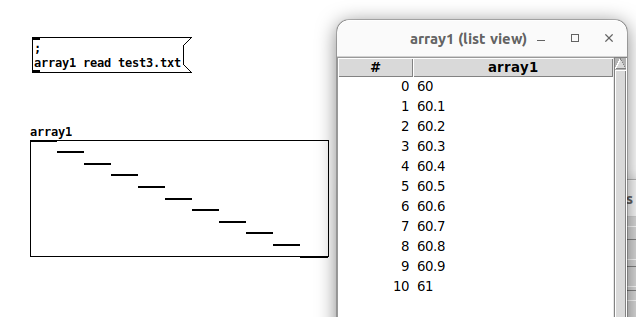
if the list of values is increasing from 60 to 61, why does the graph appear decreasing?
In the array1 properties I set x from 0 to 11, y from 60 to 61.
test_array.pd
test3.txt
[pd 0.54.0 on linux]
Thank you,
a.
Array issue
Hi,
if the list of values is increasing from 60 to 61, why does the graph appear decreasing?
In the array1 properties I set x from 0 to 11, y from 60 to 61.
test_array.pd
test3.txt
[pd 0.54.0 on linux]
Thank you,
a.
"Il n’y a de création que dans l’imprévisible devenant nécessité." (Pierre Boulez)
@atux Your Y-range is is backwards, Y-range goes from Ymax to Ymin. Or is it that pd's Y-range is backwards? It has to do with data structures and GOPs and how they are drawn, left to right and top to bottom.
@oid said:
@atux Y-range goes from Ymax to Ymin.
So in the array properties it must be set:
x from min to max;
y from max to min.
In fact, setting x from 0 to 11, y from 61 to 60, it's drawn correctly.
OK, thank you,
a.
"Il n’y a de création que dans l’imprévisible devenant nécessité." (Pierre Boulez)
Oops! Looks like something went wrong!
