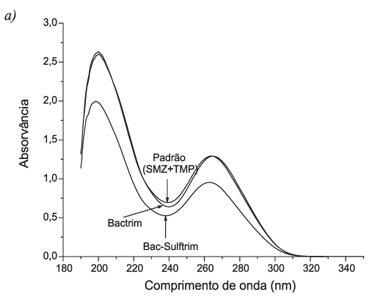
I have a work assigned to translate some Graphs from UV lightning on molecules to an array in Pure Data. Im trying to find a way to get the Quadratic Equations that have complex numbers to show on a somewhat precise array or graph, so i can use these numbers for frequencies, to create a movable bar to select a pixel of the graphic. Is this possible in PureData? is this task impossible? I've left a graph we were going to use, for reference. We have Y going all over to 340 and x to 3. But, having the equation to this, am i able to write it down in puredata to generate this graph? Is there a guide to write Quadratic Equations in PureData?
-
Complex Numbers for an array
-
@Luizagimenez said:
I have a work assigned to translate some Graphs from UV lightning on molecules to an array in Pure Data. Im trying to find a way to get the Quadratic Equations that have complex numbers to show on a somewhat precise array or graph, so i can use these numbers for frequencies, to create a movable bar to select a pixel of the graphic.
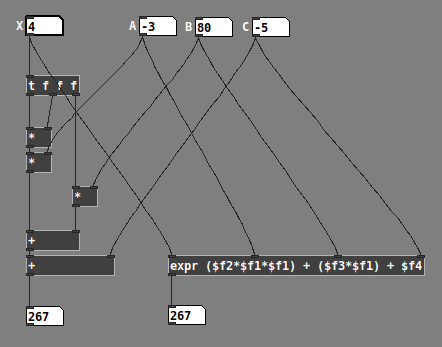
Pd can express any math formula, but it's more cumbersome for complicated math expressions than a text-based language. [expr] helps somewhat, though. A real-number (no complex) quadratic would look like this:
If a quadratic is ax2 + bx + c, and you need complex numbers, is it that a, b and c can be complex, or only x? Your graph suggests a real-number domain, in which case complex a, b, c would be the sum of 2 quadratics, one multiplied by i. So, the above patch, but duplicated, to give you a real and an imaginary result.
If x can be complex too, then it's more involved than that.
hjh