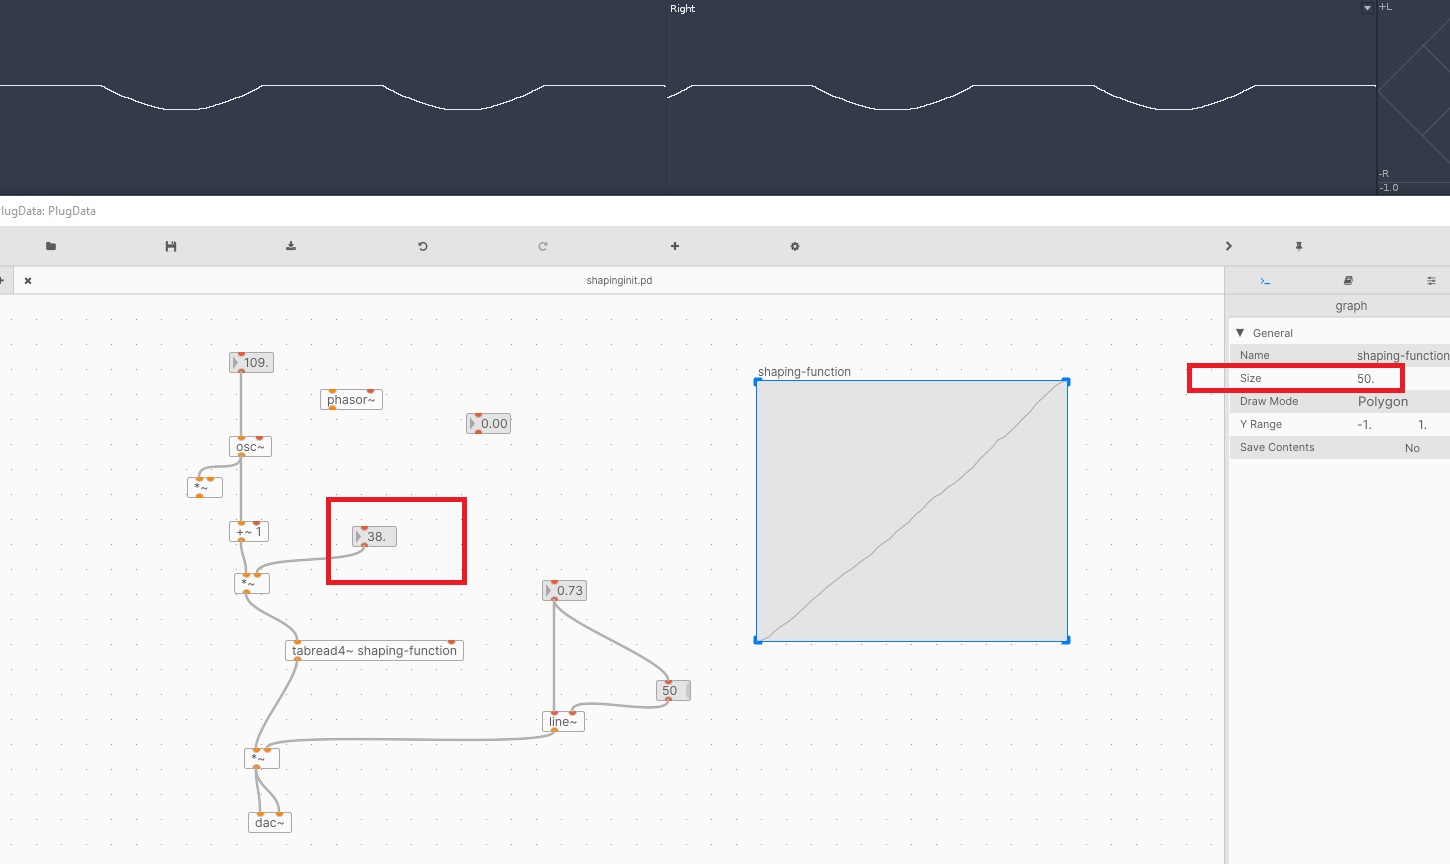
I have a tabread which dtueis as a shaping function , the y input is -1, +1 , the x input is 50
The input signal is a sine wave offsetted , so nothing below zero .
As you can see , the shaping function is cutting of the top end while the input signal is multied by 39 .
It should give a more or less clean sine since the trasnfer function is linear

-
Shaping function
-
@gentleclockdivider [osc~] outputs -1 .. 1, then you add 1 to shift it to 0 .. 2, then you multiply by 38 to get 0 .. 76. But your table only has 50 points of data, so I assume [tabread4~ is just using the highest value in the table for indexes 50 .. 76. So what you're graphing at the top looks correct to me, except maybe for that little discontinuity labeled "right" which I don't understand, not knowing plugdata. Try reducing that number in the red box to 25 or less.
-
tabread4~ uses cubic interpolation, which requires the two samples you're interpolating, plus one before and one after.
x-1   x     x+1   x+2
      \____/ x in here
If your array has size 50, then it contains indices 0 to 49.
Of these, 0 is reserved for the "pre-sample" and 47 and 48 are reserved for the +1 and +2 samples.
So the usable range is 1 to 46.9999.
So you would need your bipolar signal --> [+~ 1] --> [*~ 22.9999] --> [+~ 1] --> [tabread4~].
Maybe you could bump 22.9999 up to 23.
tabread4~ takes a little care that way.
hjh
-
@jameslo said:
that little discontinuity labeled "right" which I don't understand
I believe it's simply another graph.
hjh
