-
phonic_avenger
posted in technical issues • read morehi everybody,
i'm new with pd and most of the objects. i have a question to which i can't find an answer by myself and i hope that some experienced user can save me some more hours.
is it possible to click on the position in the graph / plot of a recorded sample and thus get the x-position / index?
i want to realize a small patch in which i can determine the different segments of an array / sample and i assume that there is a way to show the output because it is very easy to change the graph manually.
tanks in advance
-
-
posted in technical issues • read more
exactly, i'm trying to plot a wav-file, or in the case of pure data an array, which for example has 882000 samples. to make the visualisation very detailed, i want to scale it in a very large width - for ex. 6000 px, but pd cuts the signal at the length of 2000 px. the visible array "container" is really 6000 px long and according to what i see of the signal it is correctly scaled with the problem that it's only visible till 2000 px. hope you can follow me
EDIT: attached a screenshot
-
-
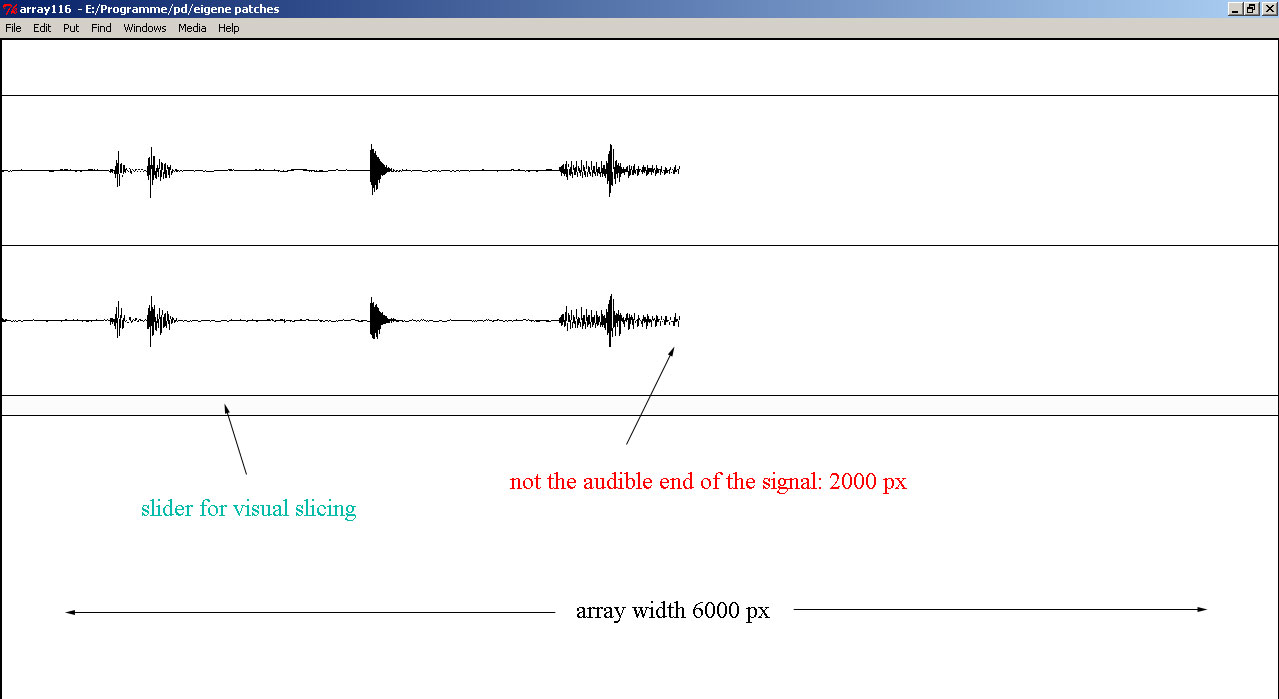
posted in technical issues • read more
tanks again,
with your help i'm almost finished with my sampler. one last question about the graph on parent function:
my graph has the X-size of 6000 but the plot only shows the signal up to the size of 2000 (draw as points). when i choose another representation (for ex. polygon) it becomes even less. is there a limit for the different figures?